🌾 Crop Health Analysis Report
MicaSense RedEdge-P Multispectral Drone Survey Analysis
Health Score
8.0
out of 10
Mean NDVI
0.521
vegetation vigor
Mean NDRE
-0.075
chlorophyll content
Captures Analyzed
80
× 6 bands each
Objects/Issues Detected
0
from AI analysis
🏥 Crop Health Classification (NDVI-Based)
Health zones derived from NDVI values across all 80 capture locations.
🗺️ Interactive GIS Map
Toggle layers using the control panel. Click markers for detailed index values.
🎨 Band Composites (Sample Capture)
True Color (RGB)
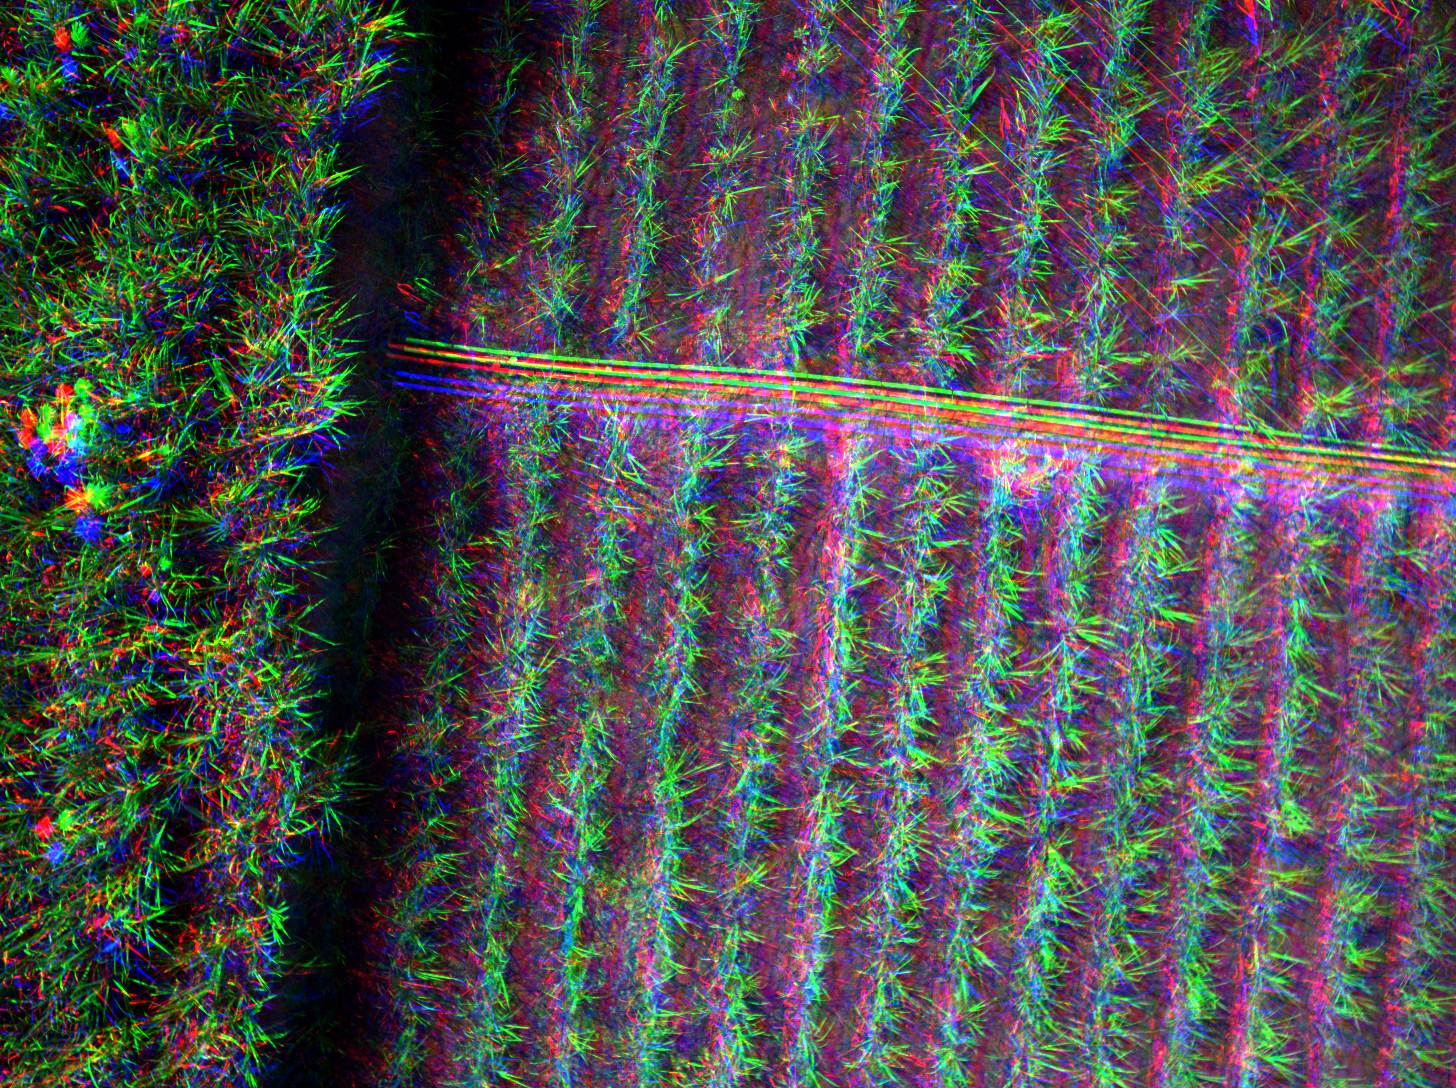
Color Infrared (NIR-R-G)
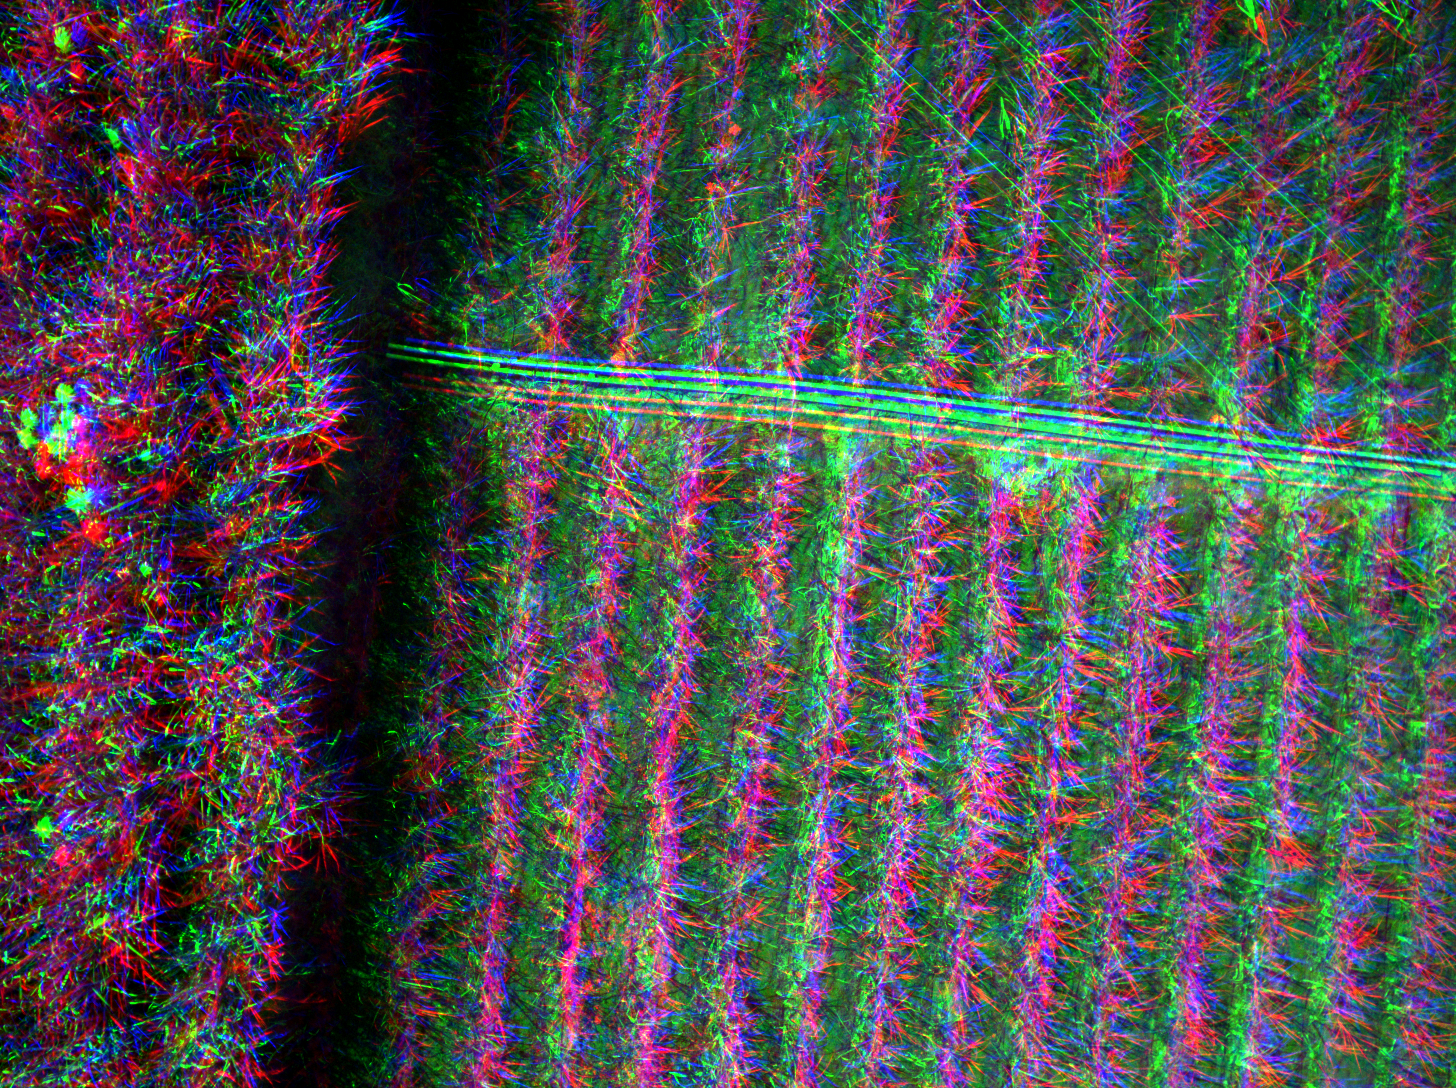
False Color (NIR-RE-R)

Raw_Pan
📊 Vegetation Index Analysis
| Index | Min | Max | Mean | Std Dev | Median |
|---|---|---|---|---|---|
| NDVI | 0.4911 | 0.5561 | 0.5214 | 0.0206 | 0.5230 |
| SAVI | 0.2538 | 0.3497 | 0.3290 | 0.0191 | 0.3350 |
| MSAVI2 | 0.2285 | 0.3342 | 0.3111 | 0.0212 | 0.3176 |
| OSAVI | 0.3033 | 0.3714 | 0.3546 | 0.0134 | 0.3556 |
| RVI | 3.2782 | 4.3852 | 3.7992 | 0.3796 | 3.8521 |
| DVI | 0.1385 | 0.2335 | 0.2074 | 0.0190 | 0.2118 |
| TVI | 0.9935 | 1.0250 | 1.0082 | 0.0099 | 1.0088 |
| NDRE | -0.1641 | -0.0269 | -0.0749 | 0.0339 | -0.0673 |
| CHL_Index | -0.1655 | 0.1662 | 0.0622 | 0.0702 | 0.0796 |
| GNDVI | 0.2190 | 0.2936 | 0.2400 | 0.0168 | 0.2351 |
| NDWI | -0.2936 | -0.2190 | -0.2400 | 0.0168 | -0.2351 |
| EVI | -2.5231 | 1.6724 | 0.4422 | 0.4108 | 0.4686 |
| SIPI | 0.9337 | 1.0134 | 0.9785 | 0.0217 | 0.9757 |
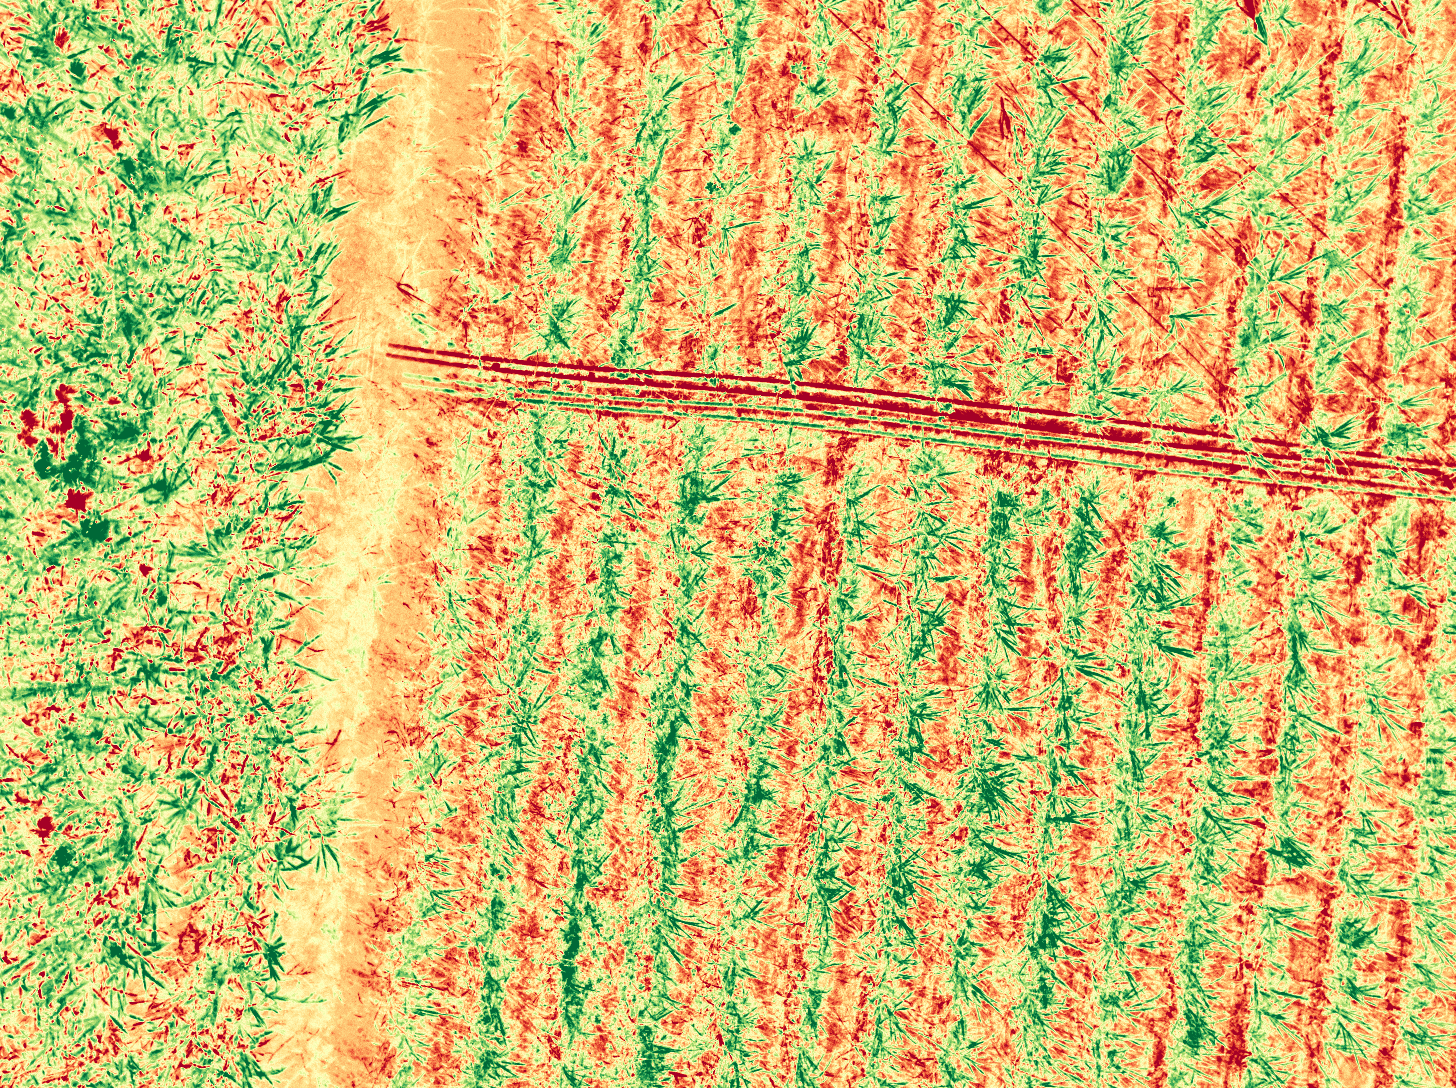
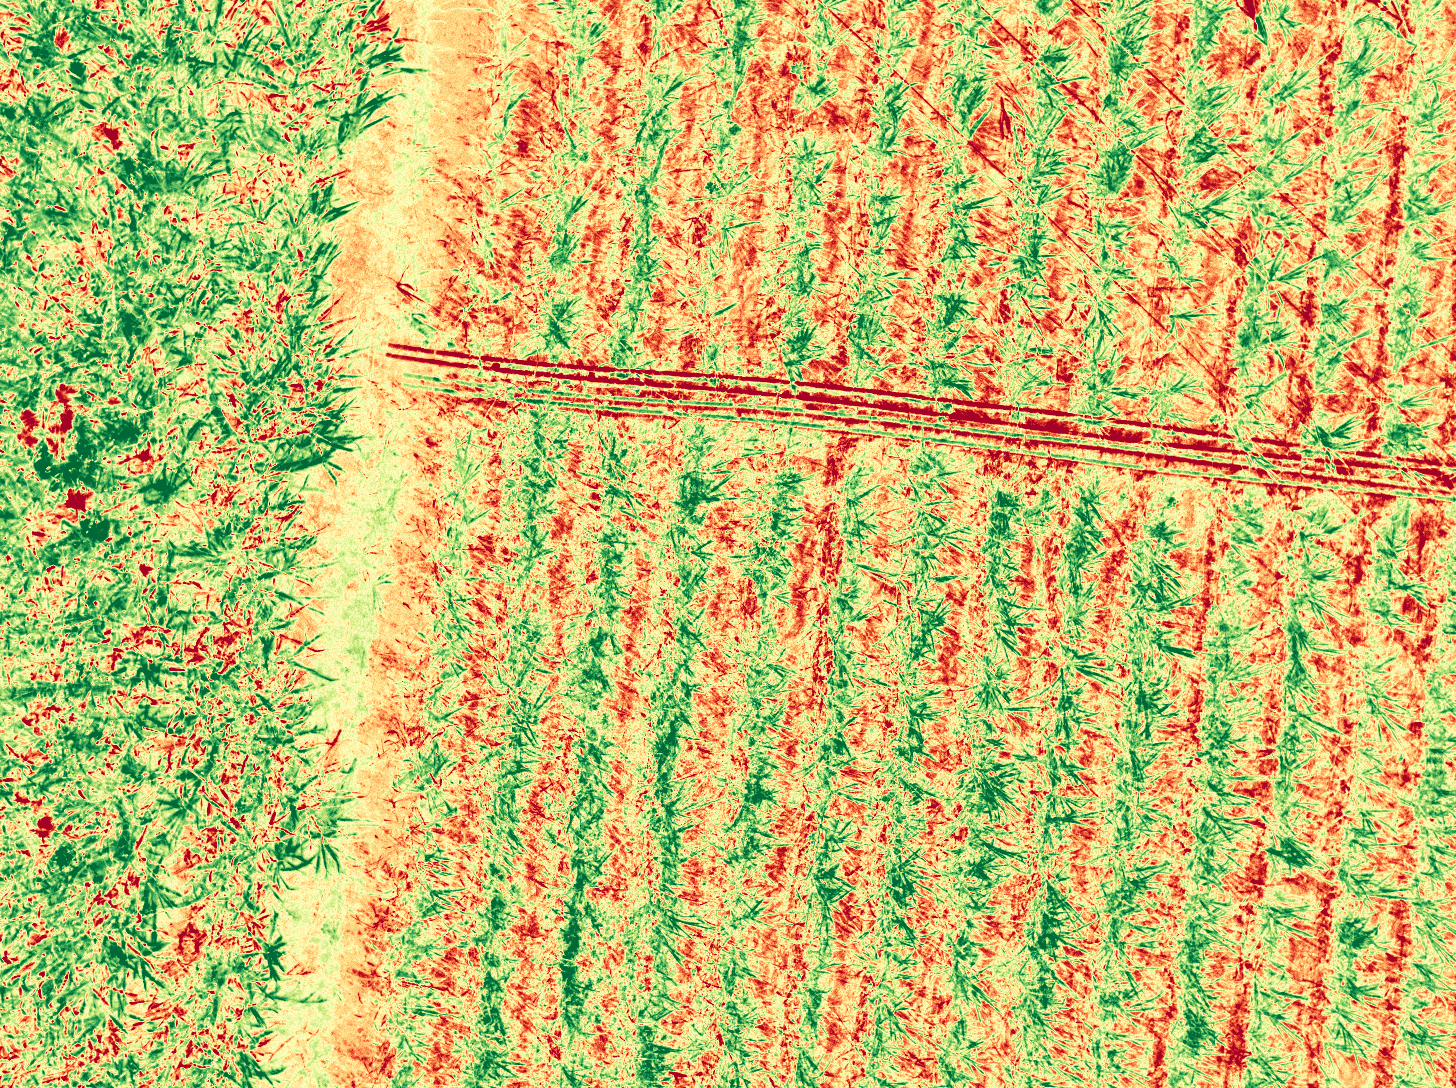
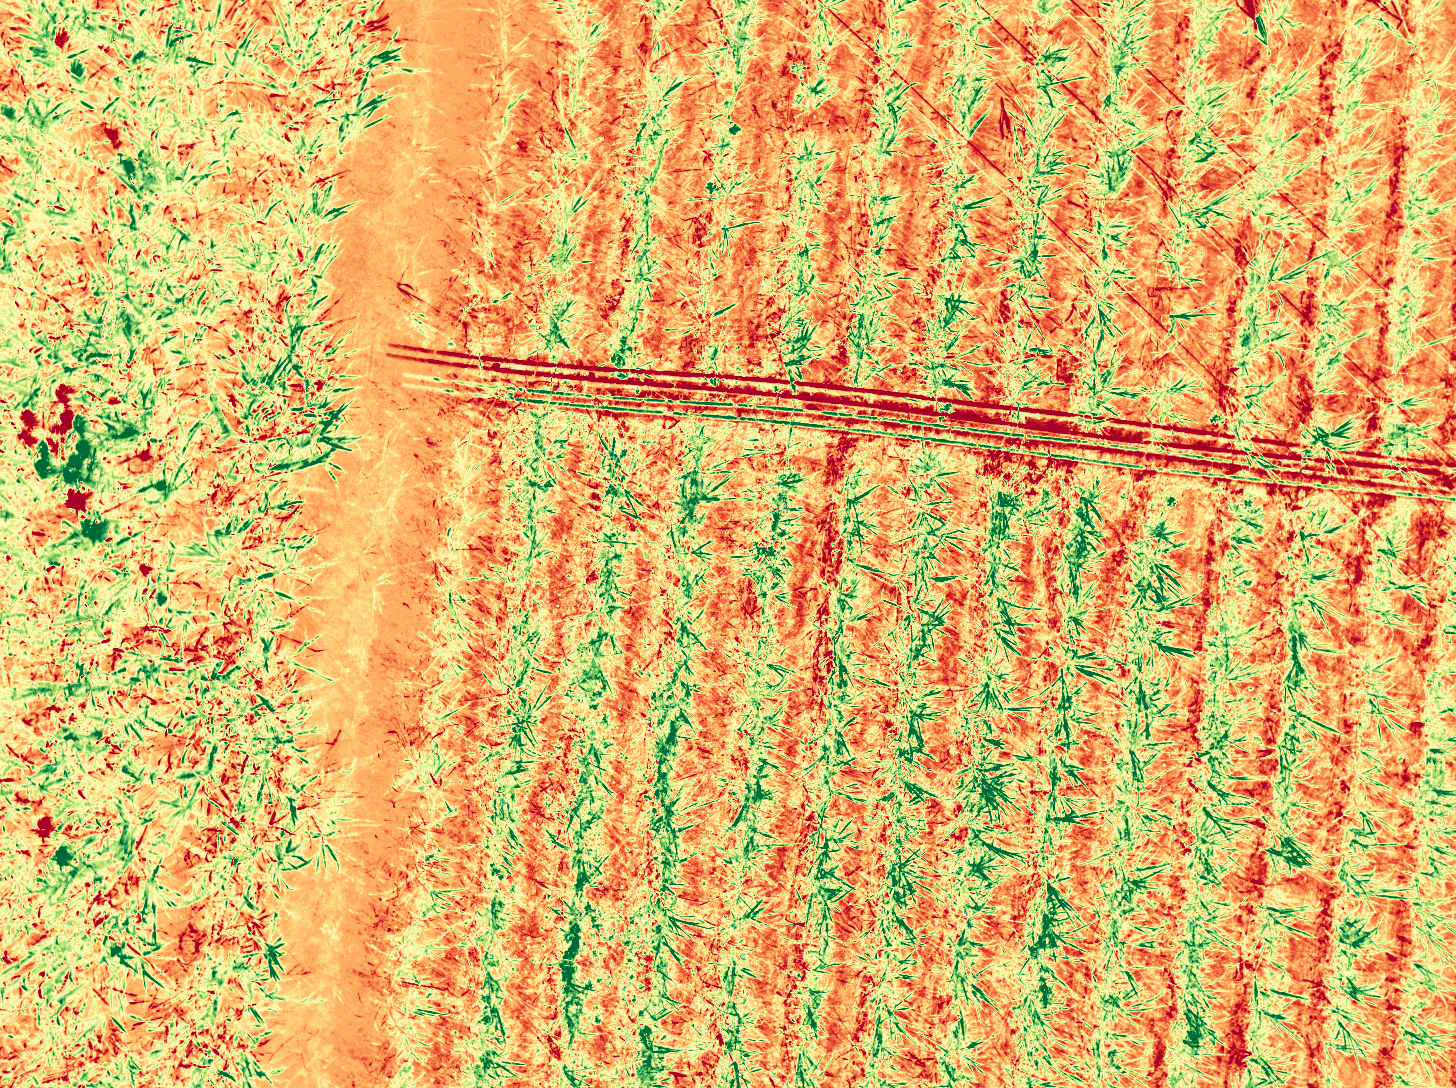
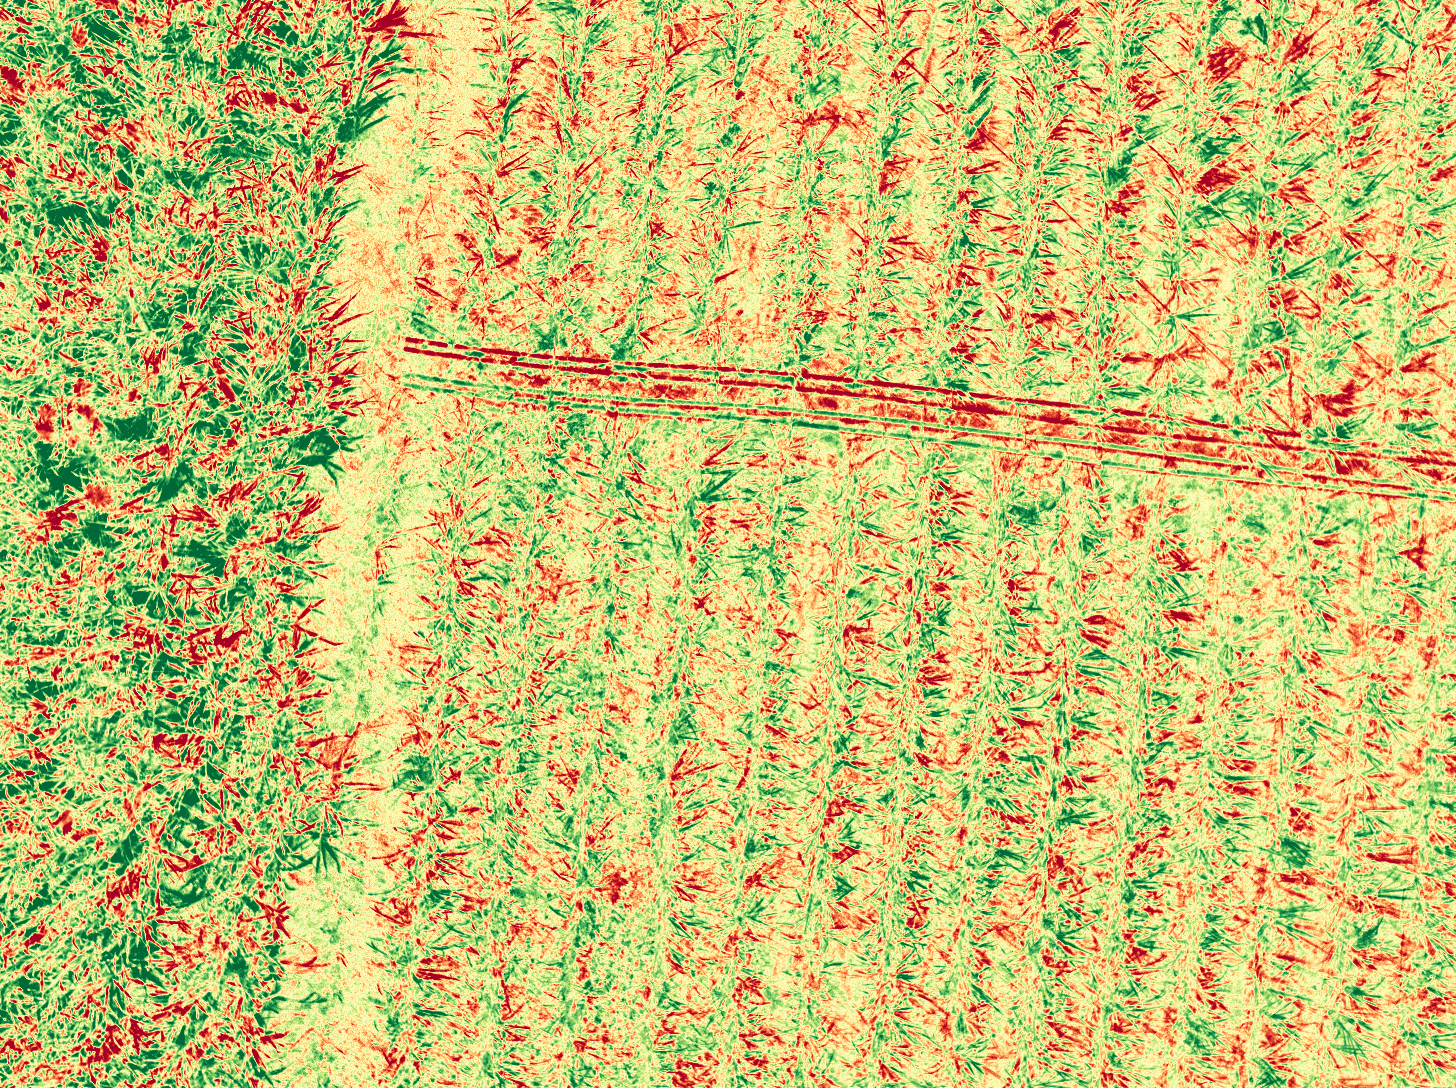
🌈 Index Visualizations (Sample Capture)
NDVI
Mean: 0.521 | Std: 0.021
SAVI
Mean: 0.329 | Std: 0.019
MSAVI2
Mean: 0.311 | Std: 0.021
OSAVI
Mean: 0.355 | Std: 0.013
RVI
Mean: 3.799 | Std: 0.380
DVI
Mean: 0.207 | Std: 0.019
TVI
Mean: 1.008 | Std: 0.010
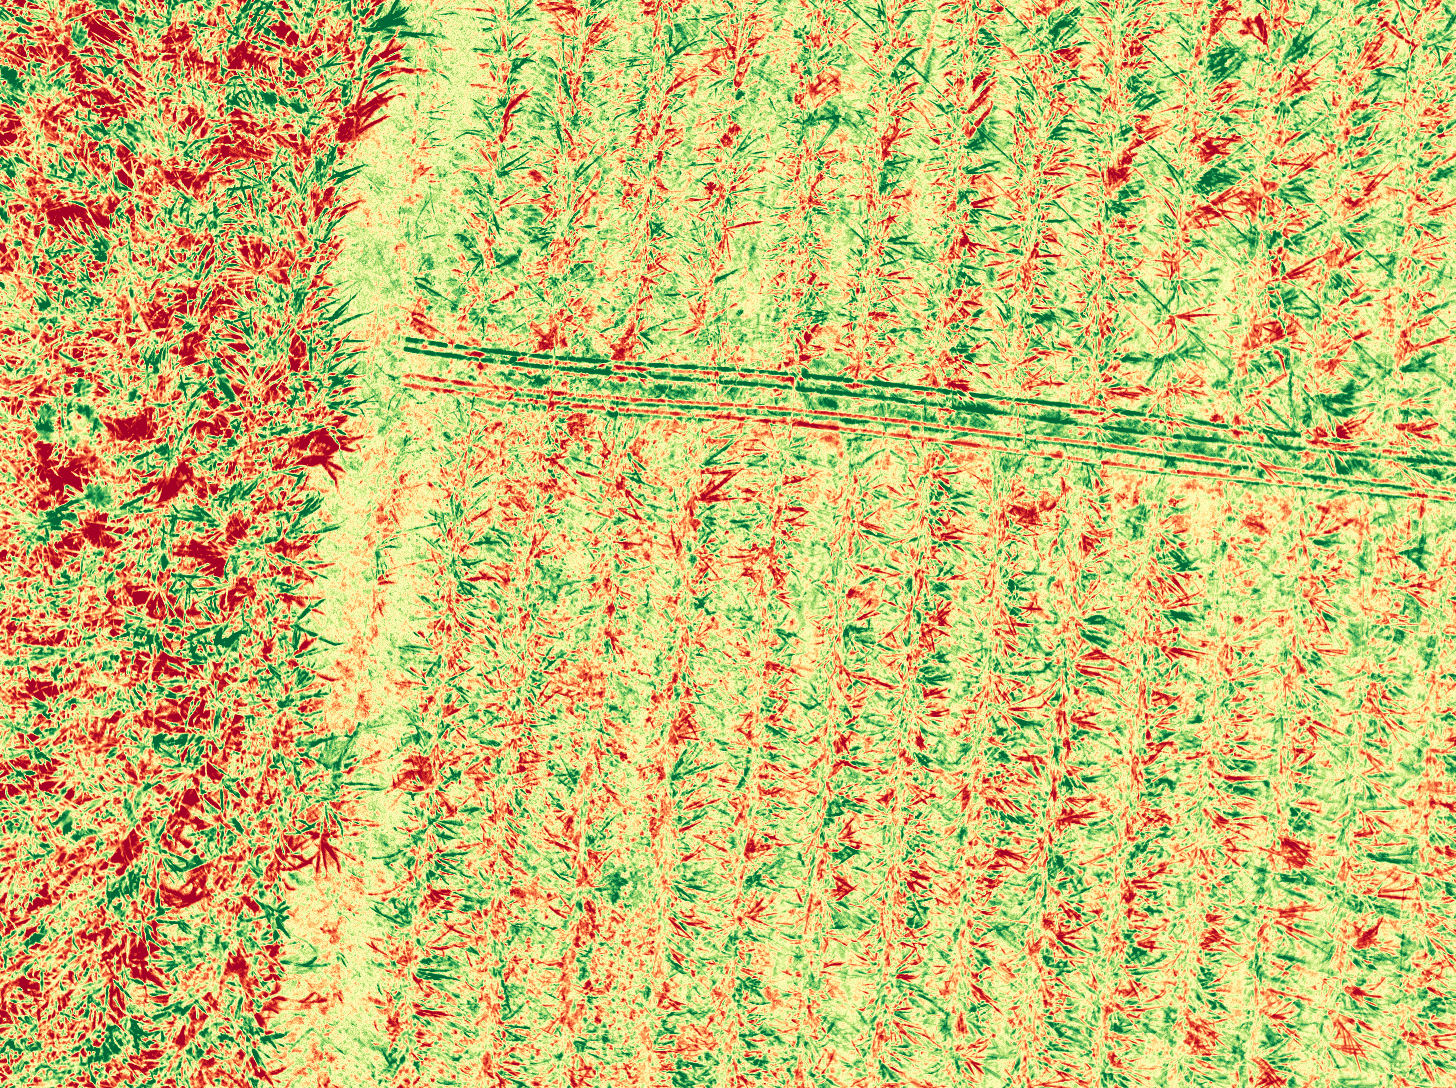
NDRE
Mean: -0.075 | Std: 0.034
CHL_Index
Mean: 0.062 | Std: 0.070
GNDVI
Mean: 0.240 | Std: 0.017
NDWI
Mean: -0.240 | Std: 0.017
EVI
Mean: 0.442 | Std: 0.411
SIPI
Mean: 0.979 | Std: 0.022
🤖 AI Expert Agronomist Insights
Generated by Gemini 2.5 Flash analyzing RGB, False Color, NDVI, and statistical data.
Executive Summary
No summary available.
🌱 Vegetation Health Analysis
Overall Vigor: N/A
Chlorophyll Content: N/A
Uniformity: N/A
⚠️ Stress & Anomalies
No significant stress or anomalies detected.
🏗️ Infrastructure & Non-Crop Objects
No infrastructure or objects detected.
🚁 Targeted Spraying Prescription
No specific spraying recommendations.
✅ Actionable Recommendations
- No recommendations available.
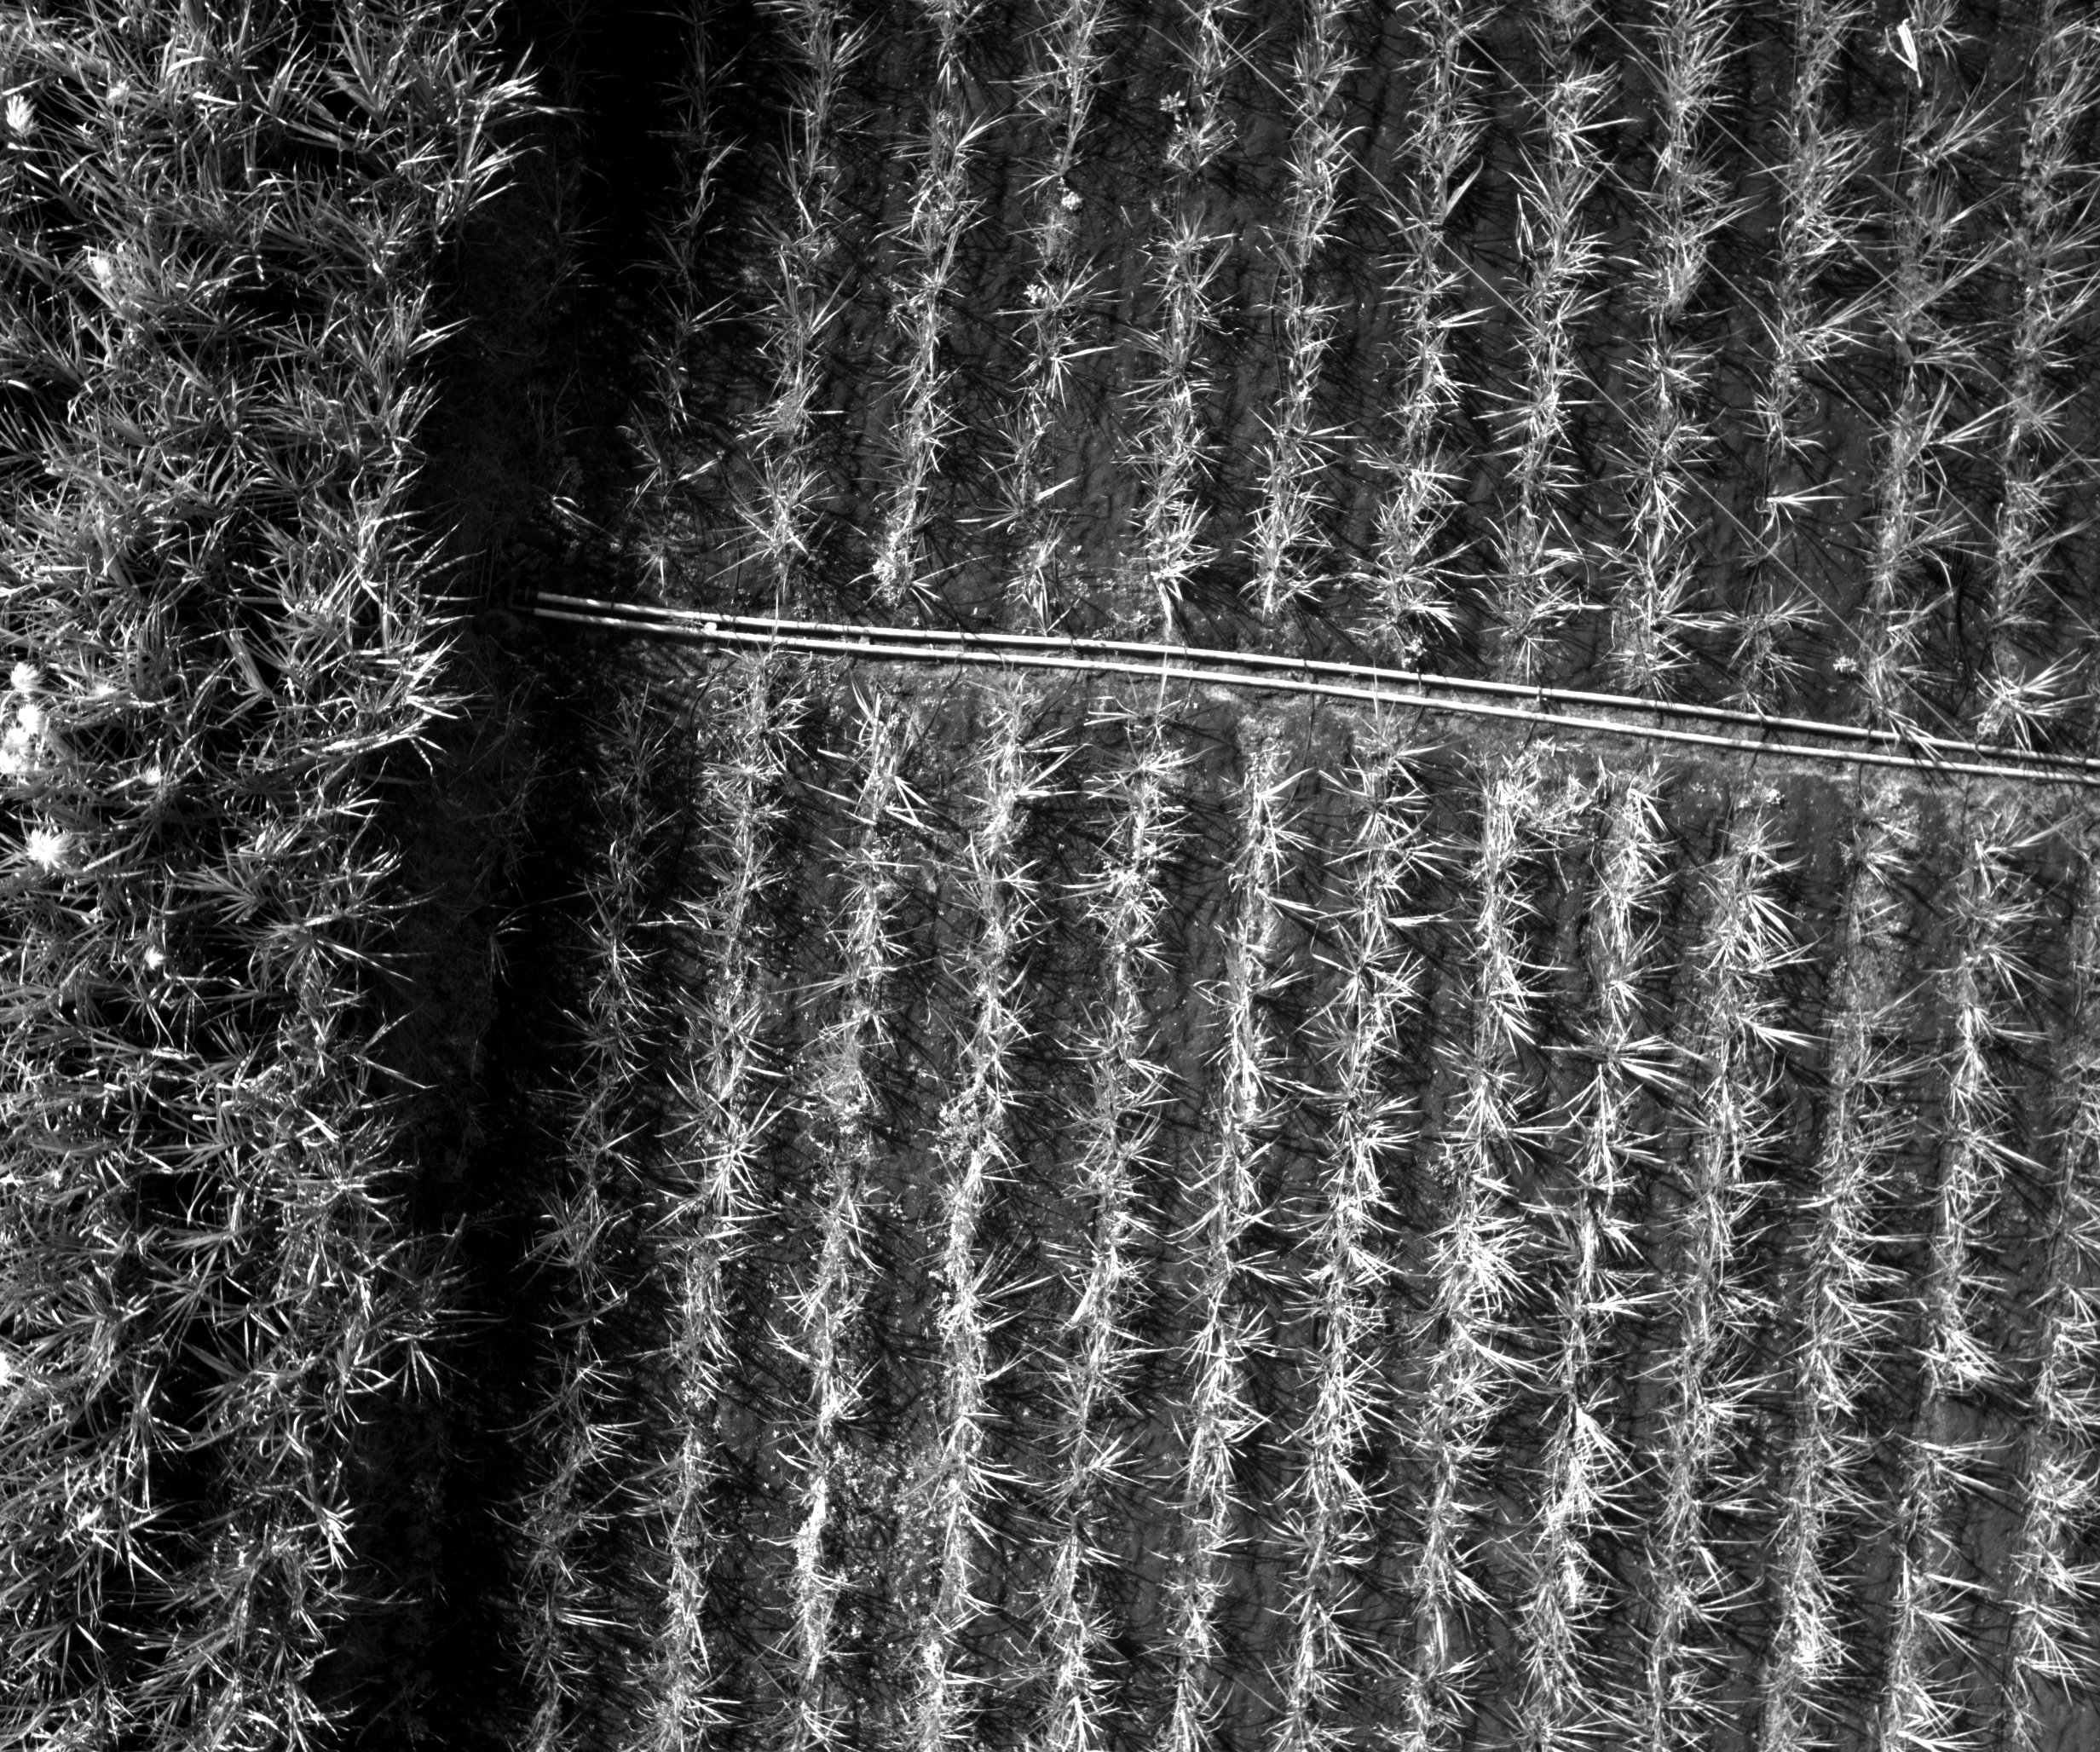
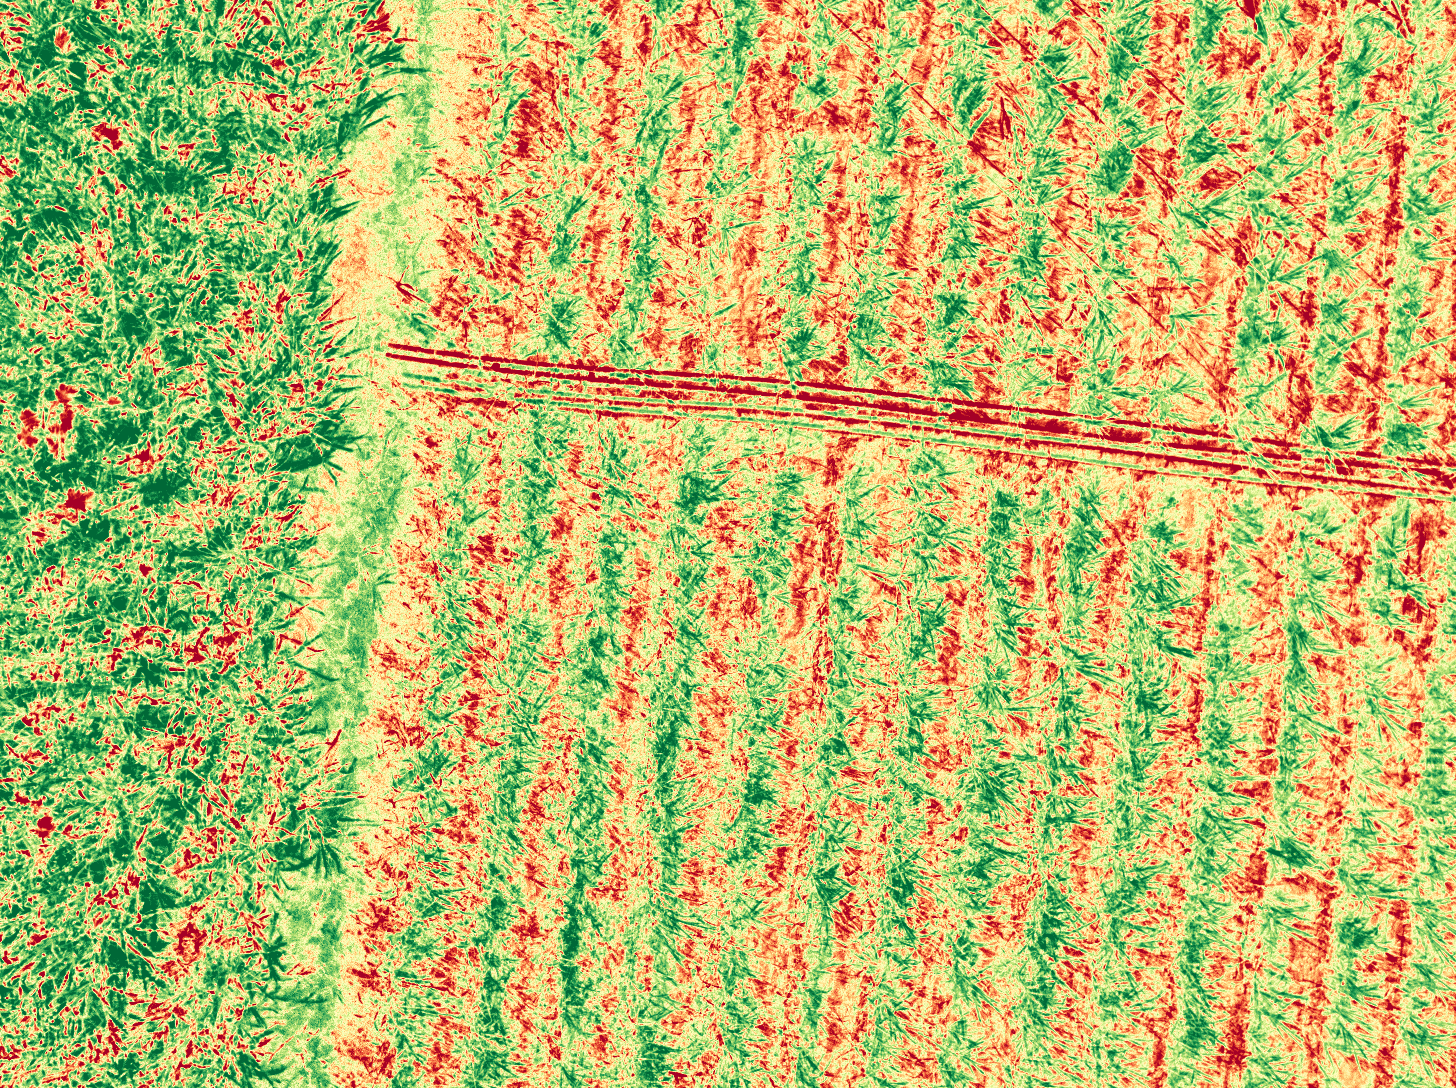
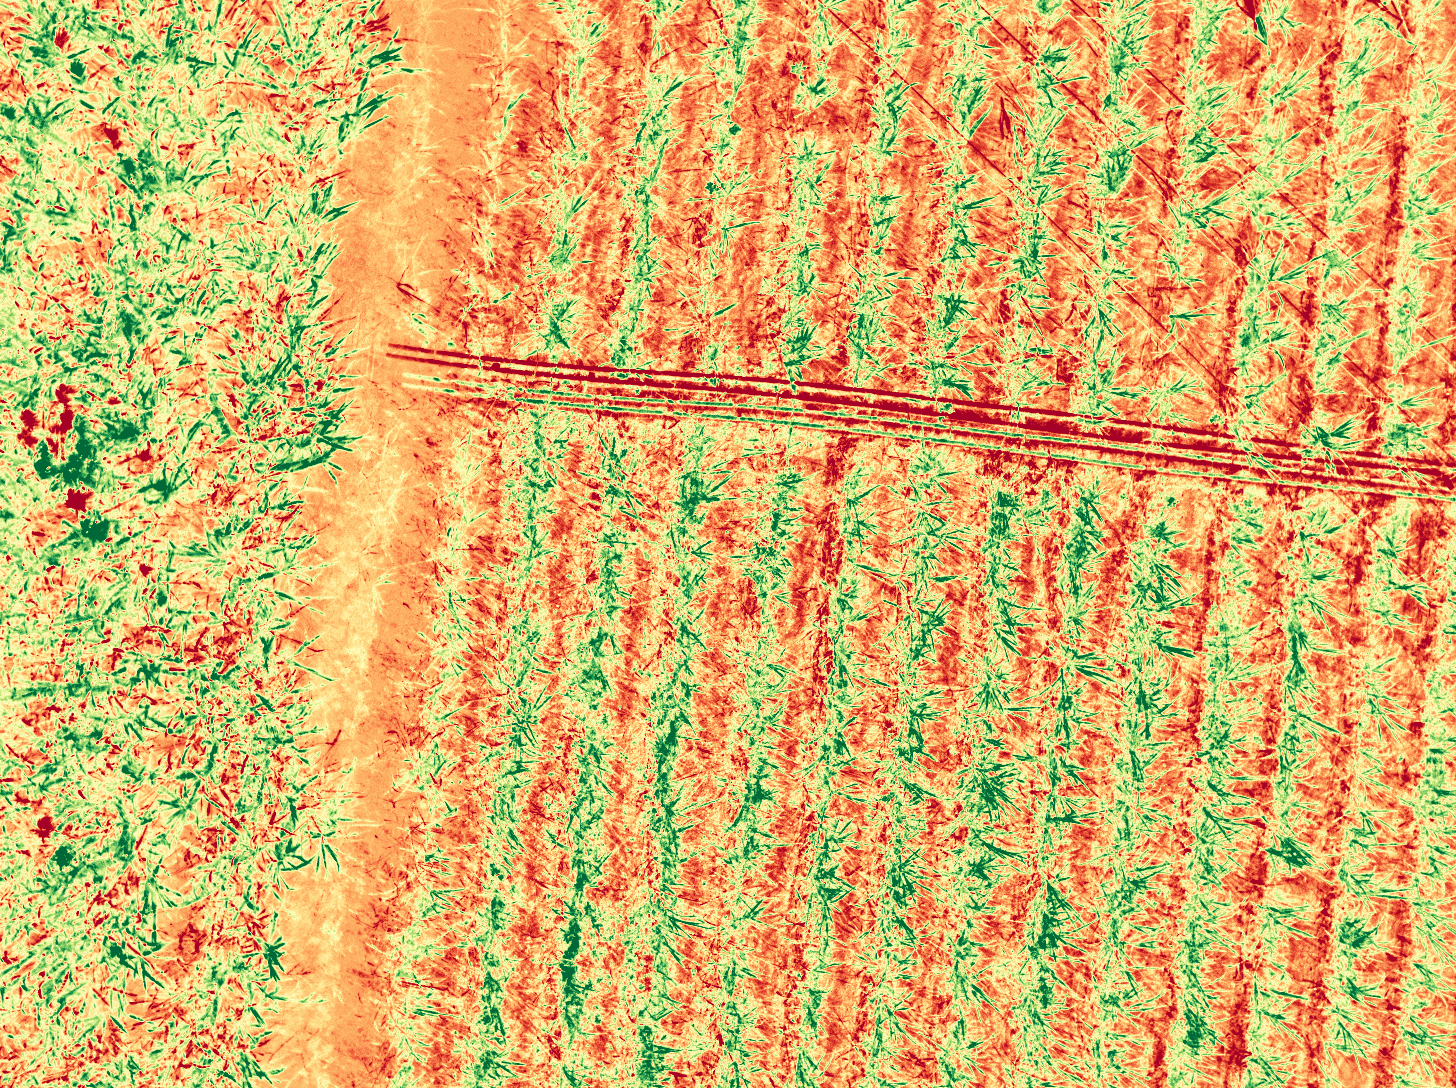
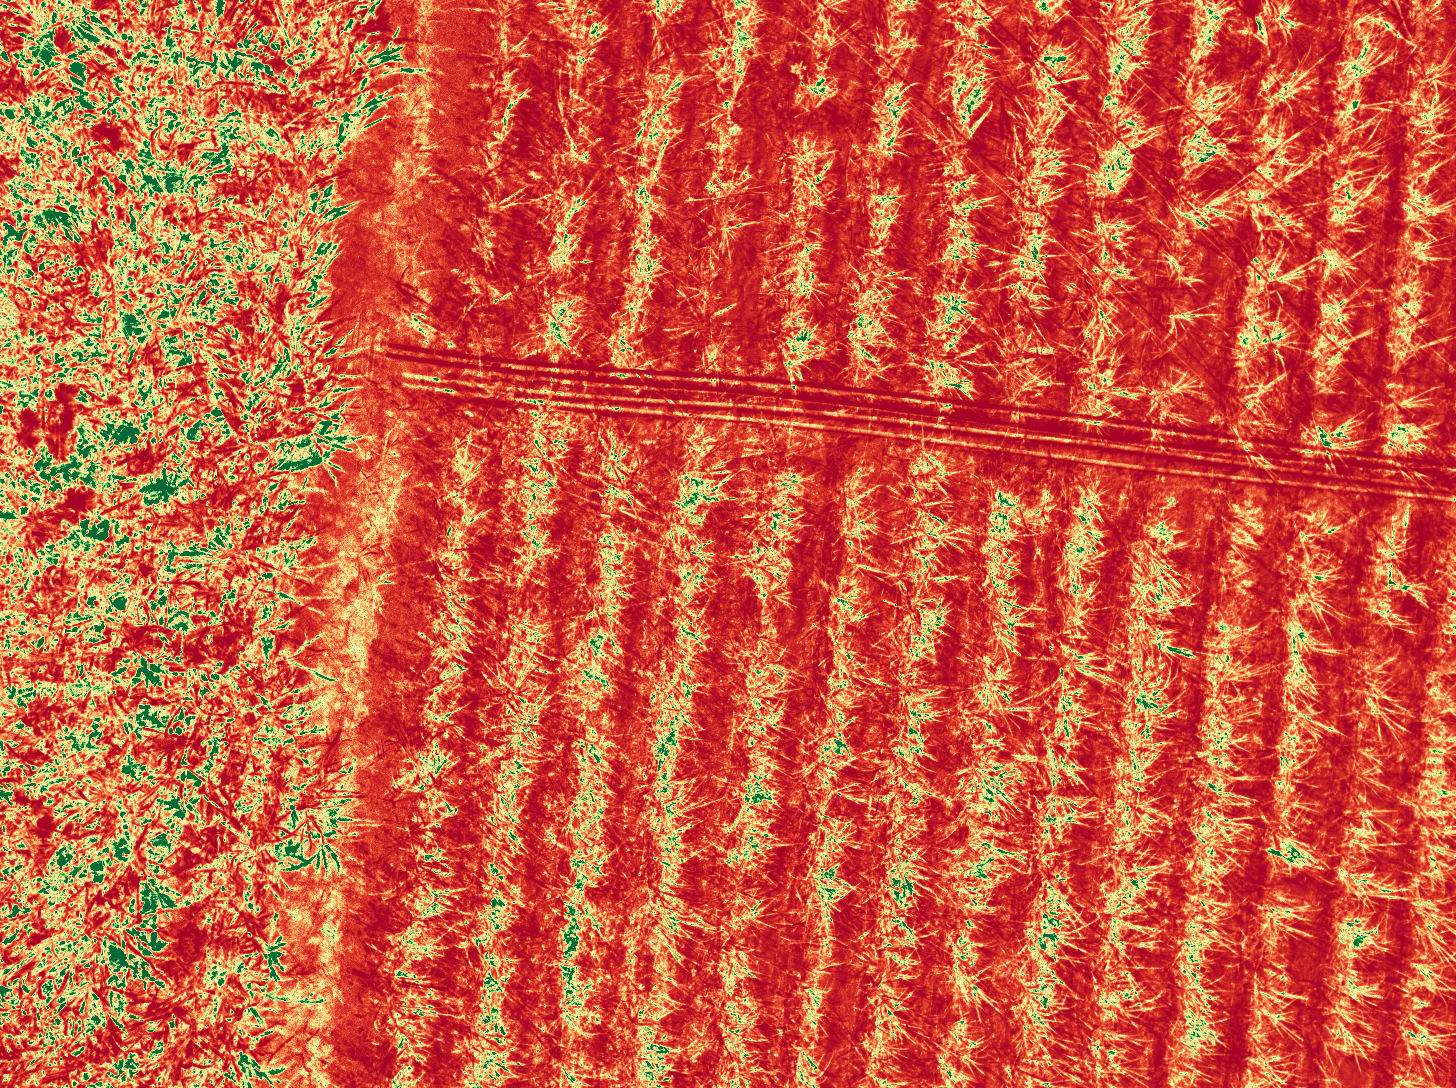
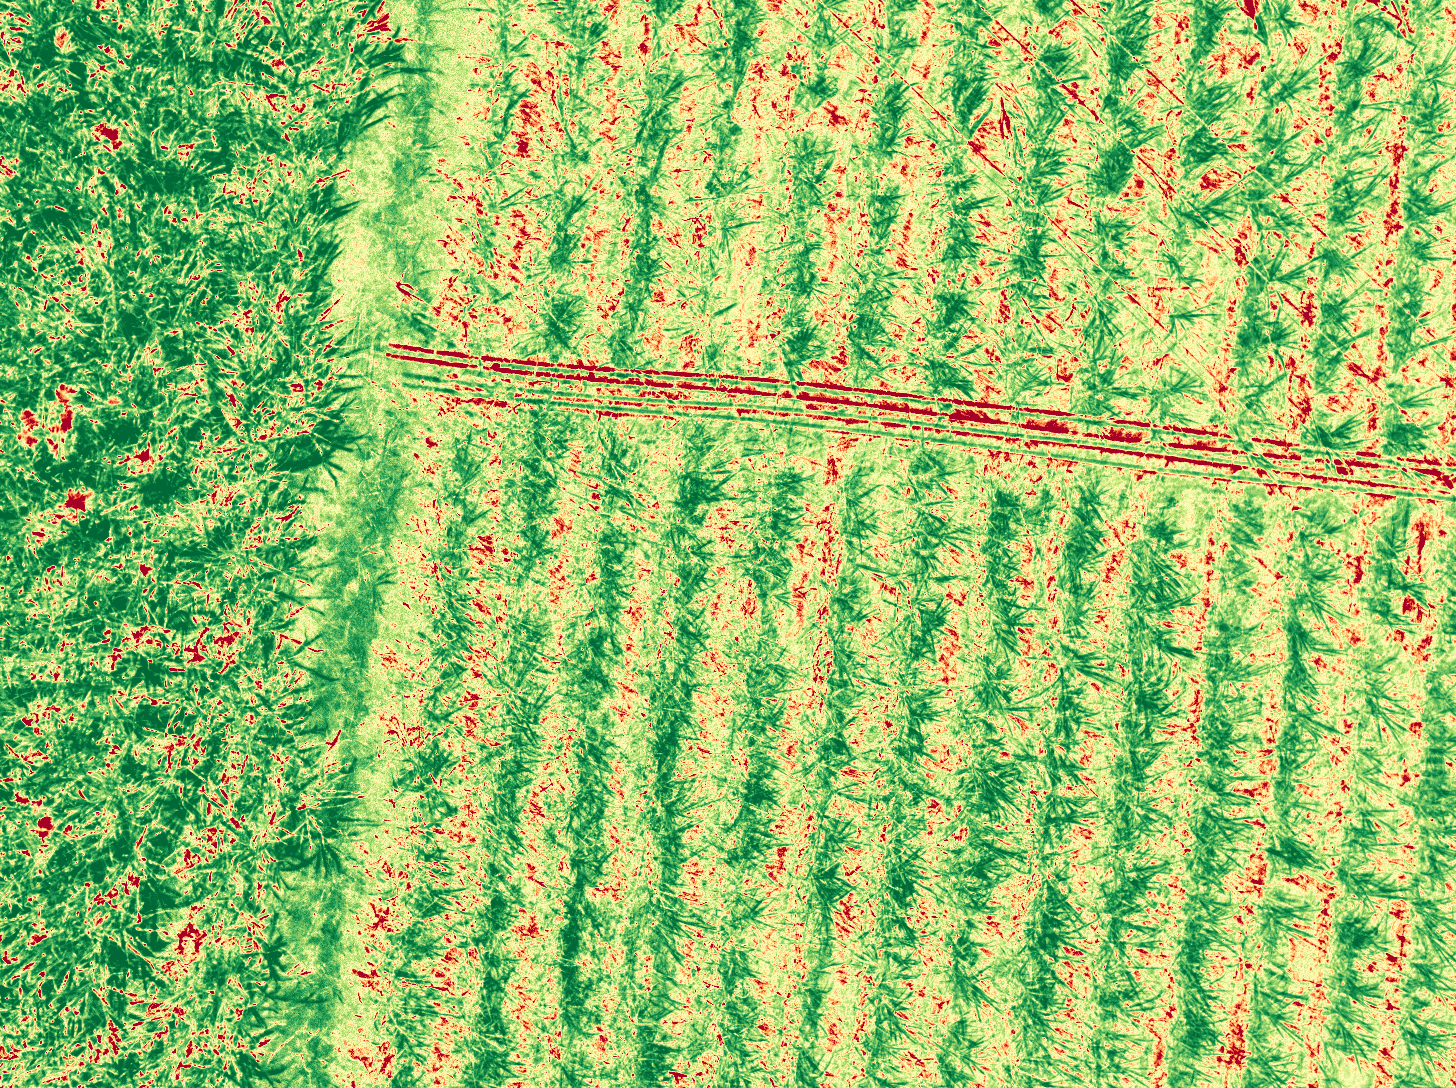
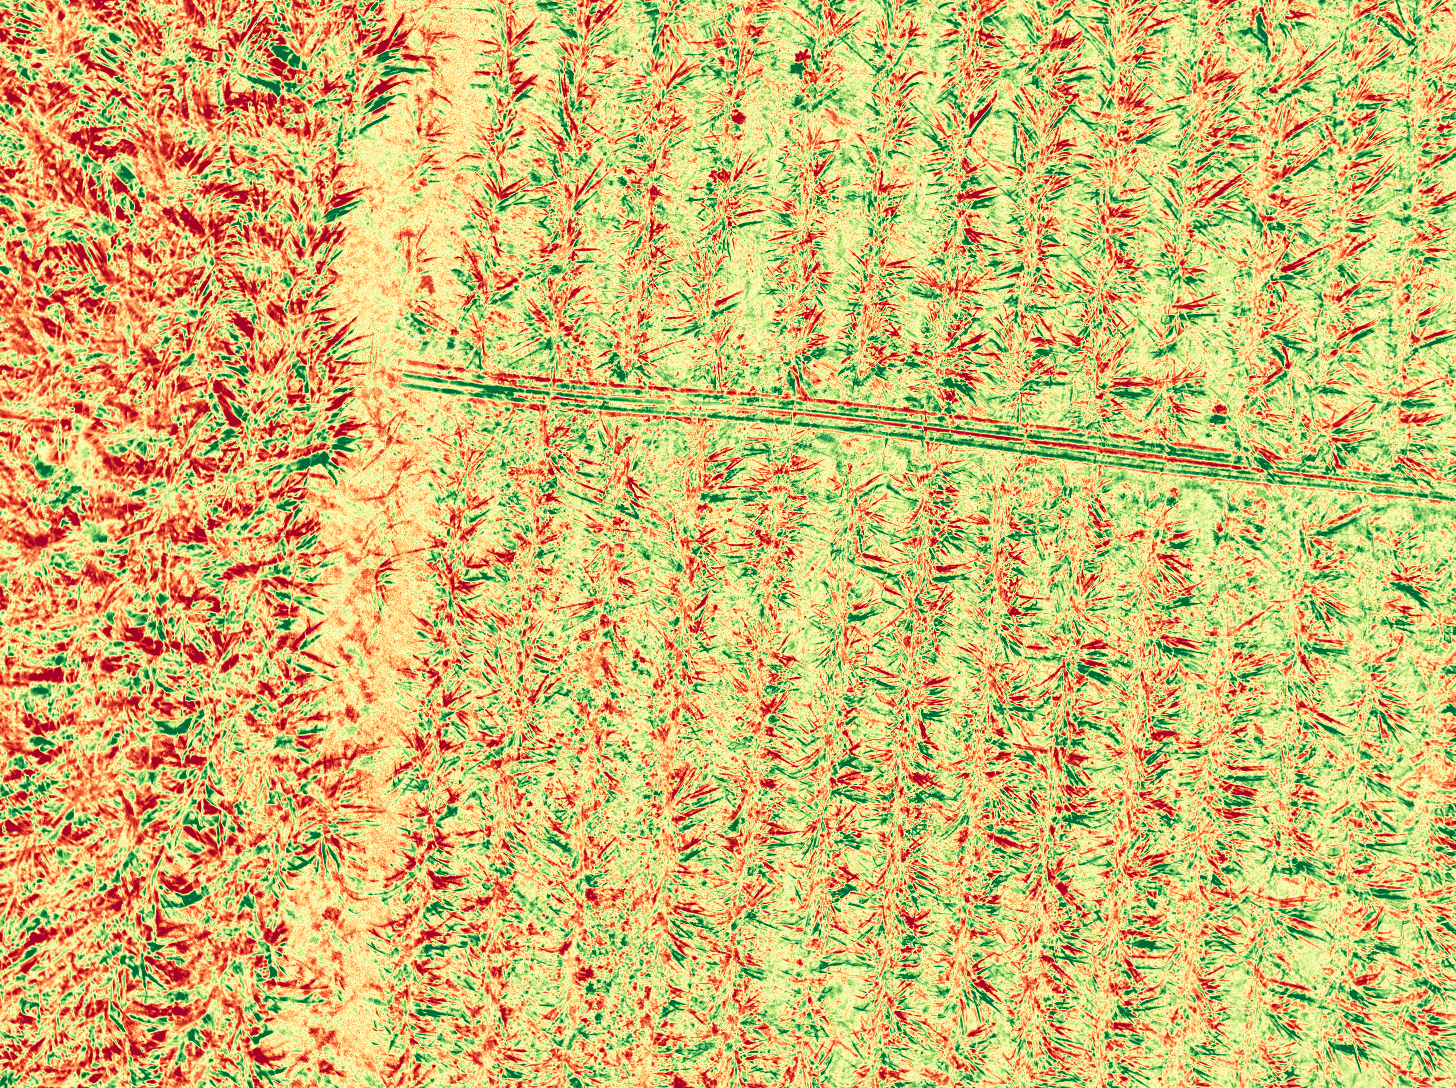
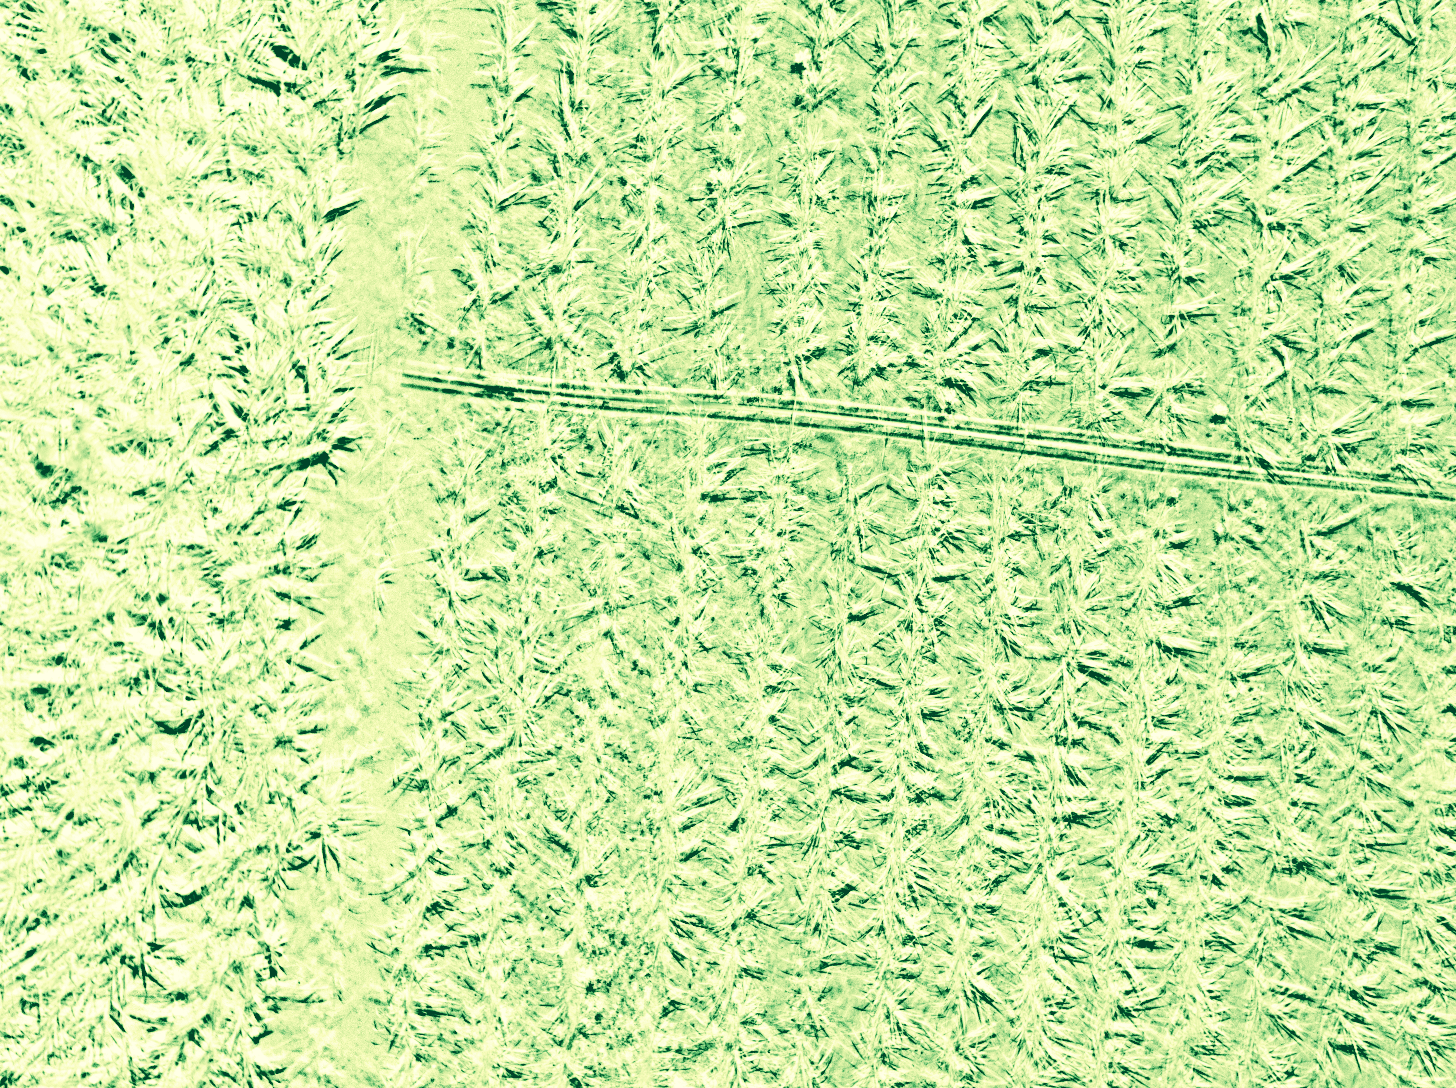
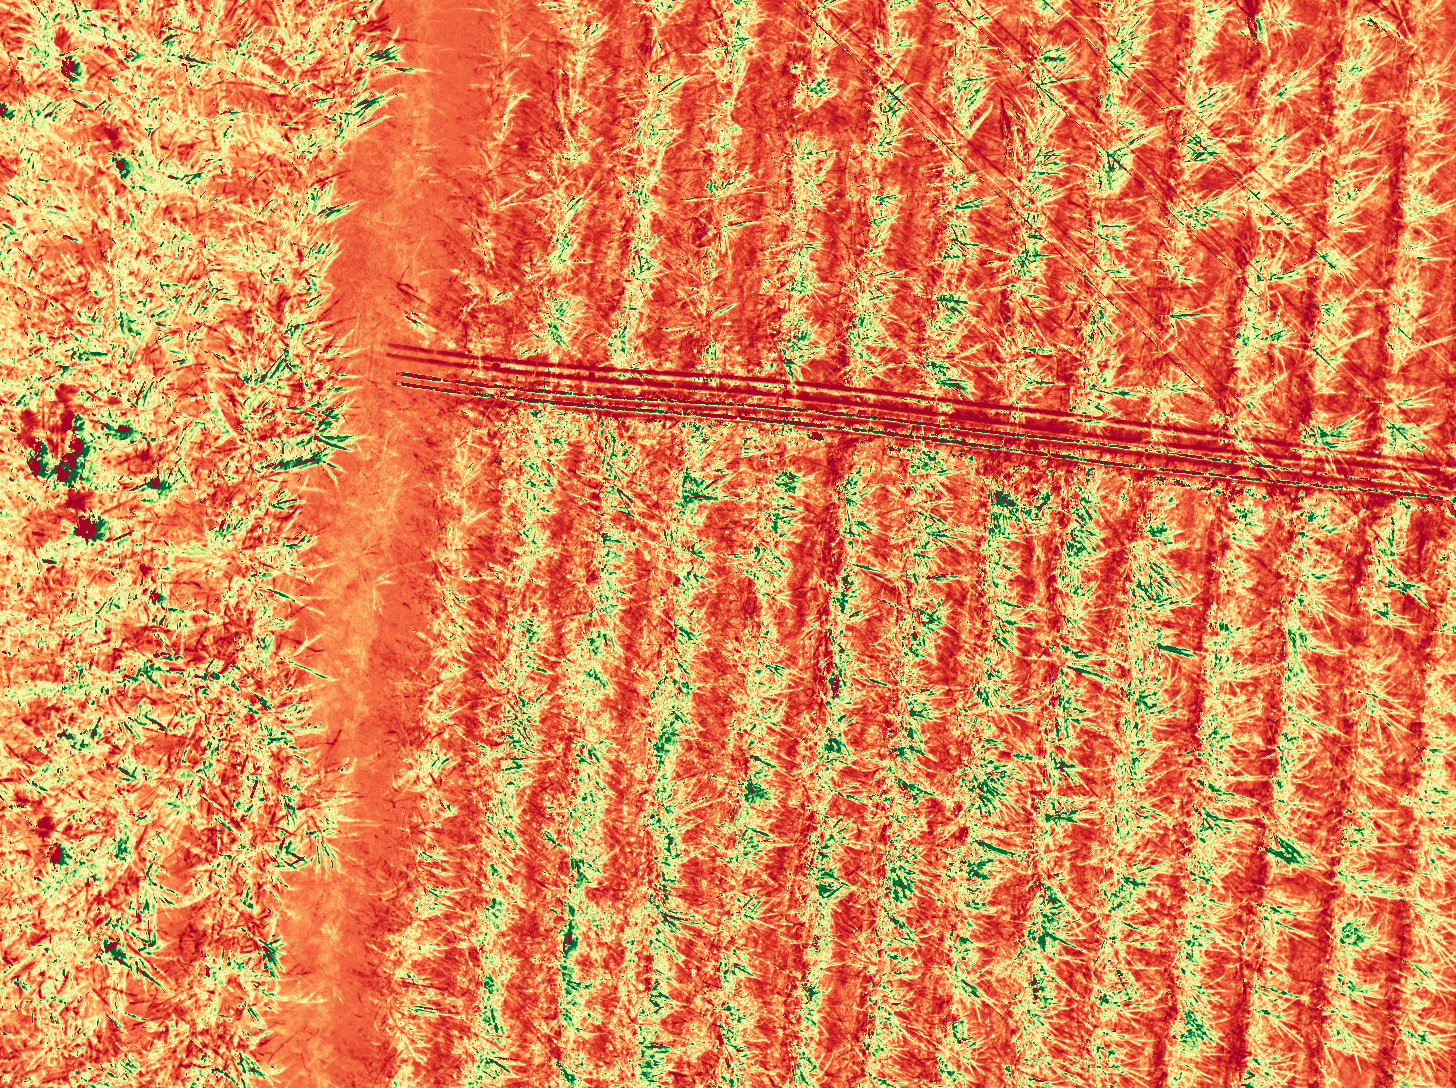
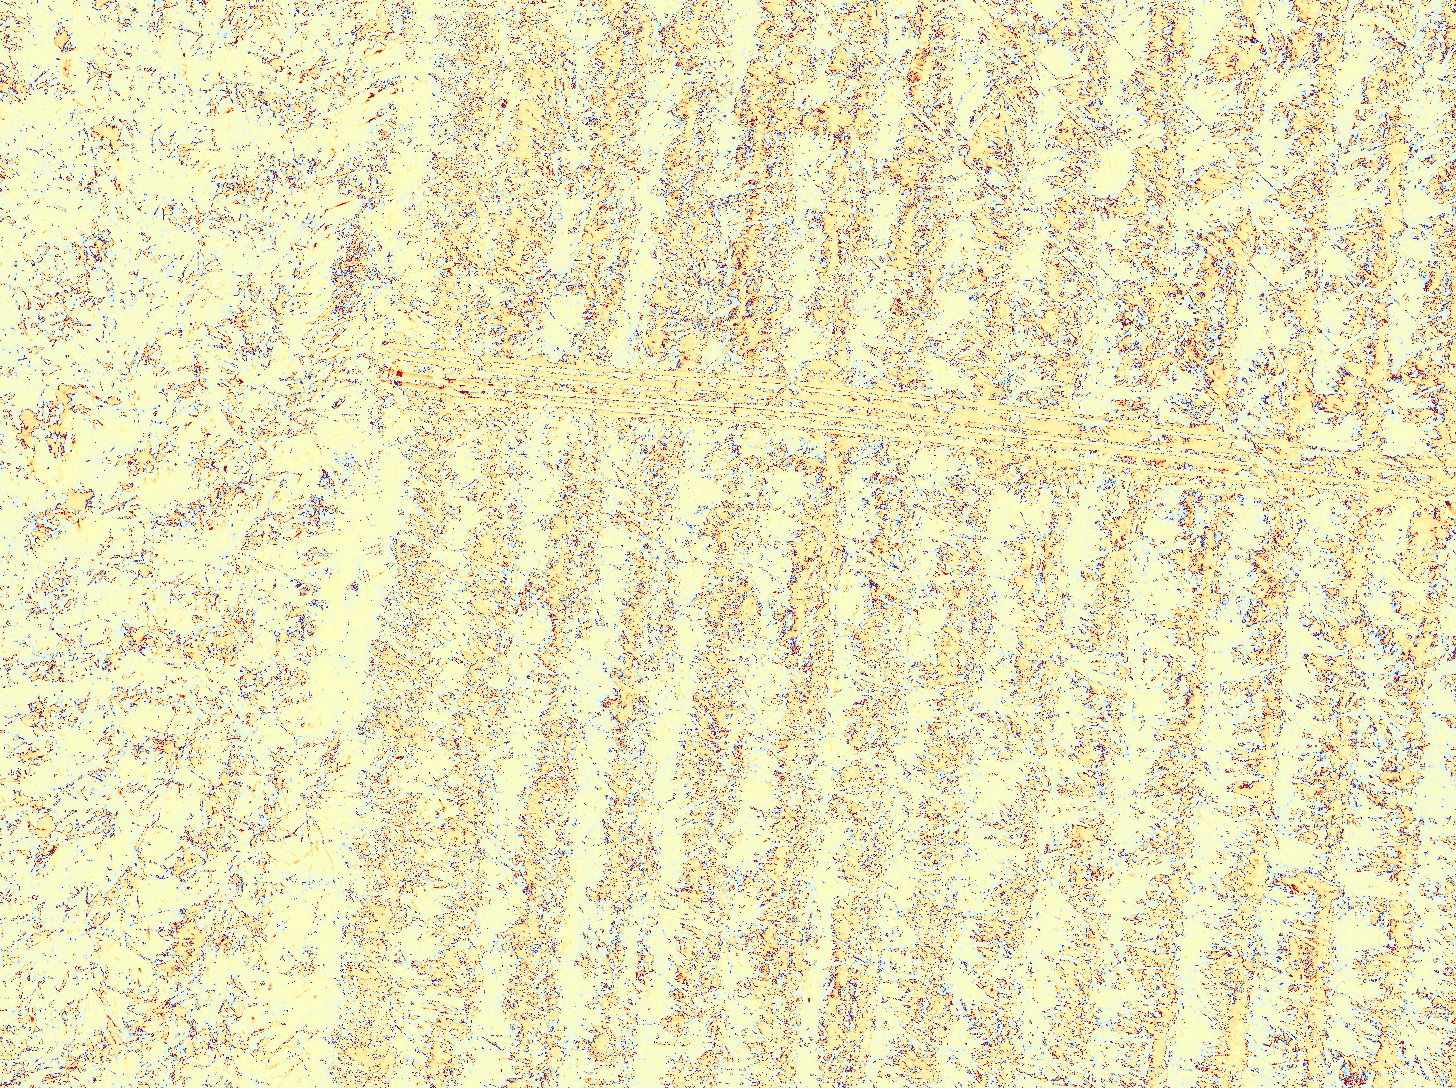
🔍 Visual Proof: Raw Sensor vs. Computed Indices
Comparing the raw unedited sensor data directly against the computed health heatmaps.
High-Resolution Panchromatic (Band 6)

Raw Near-Infrared (Band 5)

NDVI Heatmap (Derived)

Raw RedEdge (Band 4)

NDRE Heatmap (Derived)

📷 Camera & Flight Information
| Camera Model | RedEdge-P |
| Serial Number | PR01-2145023-MS |
| Firmware | v1.3.2 |
| Flight Date | 2025:12:17 08:42:41 |
| Altitude (avg) | 612.8 m |
| Spectral Bands | Blue (475nm), Green (560nm), Red (668nm), RedEdge (717nm), NIR (842nm), Panchromatic |
| Sensor Resolution | 1456×1088 (MS) / 2464×2056 (Pan) |
| GPS Bounds | 16.974145°N to 16.974241°N, 74.328769°E to 74.329412°E |
| Total Images | 480 (80 captures × 6 bands) |