🌾 Crop Health Analysis Report
MicaSense RedEdge-P Multispectral Drone Survey Analysis
🏥 Crop Health Classification (NDVI-Based)
Health zones derived from NDVI values across all 80 capture locations.
📋 Observations from Multispectral Drone Survey
By correlating high-resolution multispectral signatures (NDVI, NDRE, NDWI, SIPI) at a Ground Sampling Distance (GSD) of 1.2 cm/px, we have pinpointed exact sub-visual stress zones. While satellite crop monitoring classified this field as 100% Healthy, precision drone analytics identified the following stress factors:
| Observation Parameter | Affected Area (Sq.ft) | % of Field Area | Detection Metric & Index Used |
|---|---|---|---|
| Nutrient Loss (Nitrogen Deficit) | 2,013 Sq.ft | 4.4% | NDRE (Normalized Difference Red Edge) < -0.13 |
| Pest / Disease (Biomass Cell Stress) | ~500 Sq.ft | 1.09% | SIPI (Structure Pigment Senescence Index) & NDRE |
| Water Stress (Canopy Moisture Deficit) | 636 Sq.ft | 1.39% | NDWI (Normalized Difference Water Index) > -0.221 |
| Weed Location (Inter-row Encroachment) | 2,938 Sq.ft | 6.42% | NDVI (Normalized Difference Vegetation Index) > 0.547 |
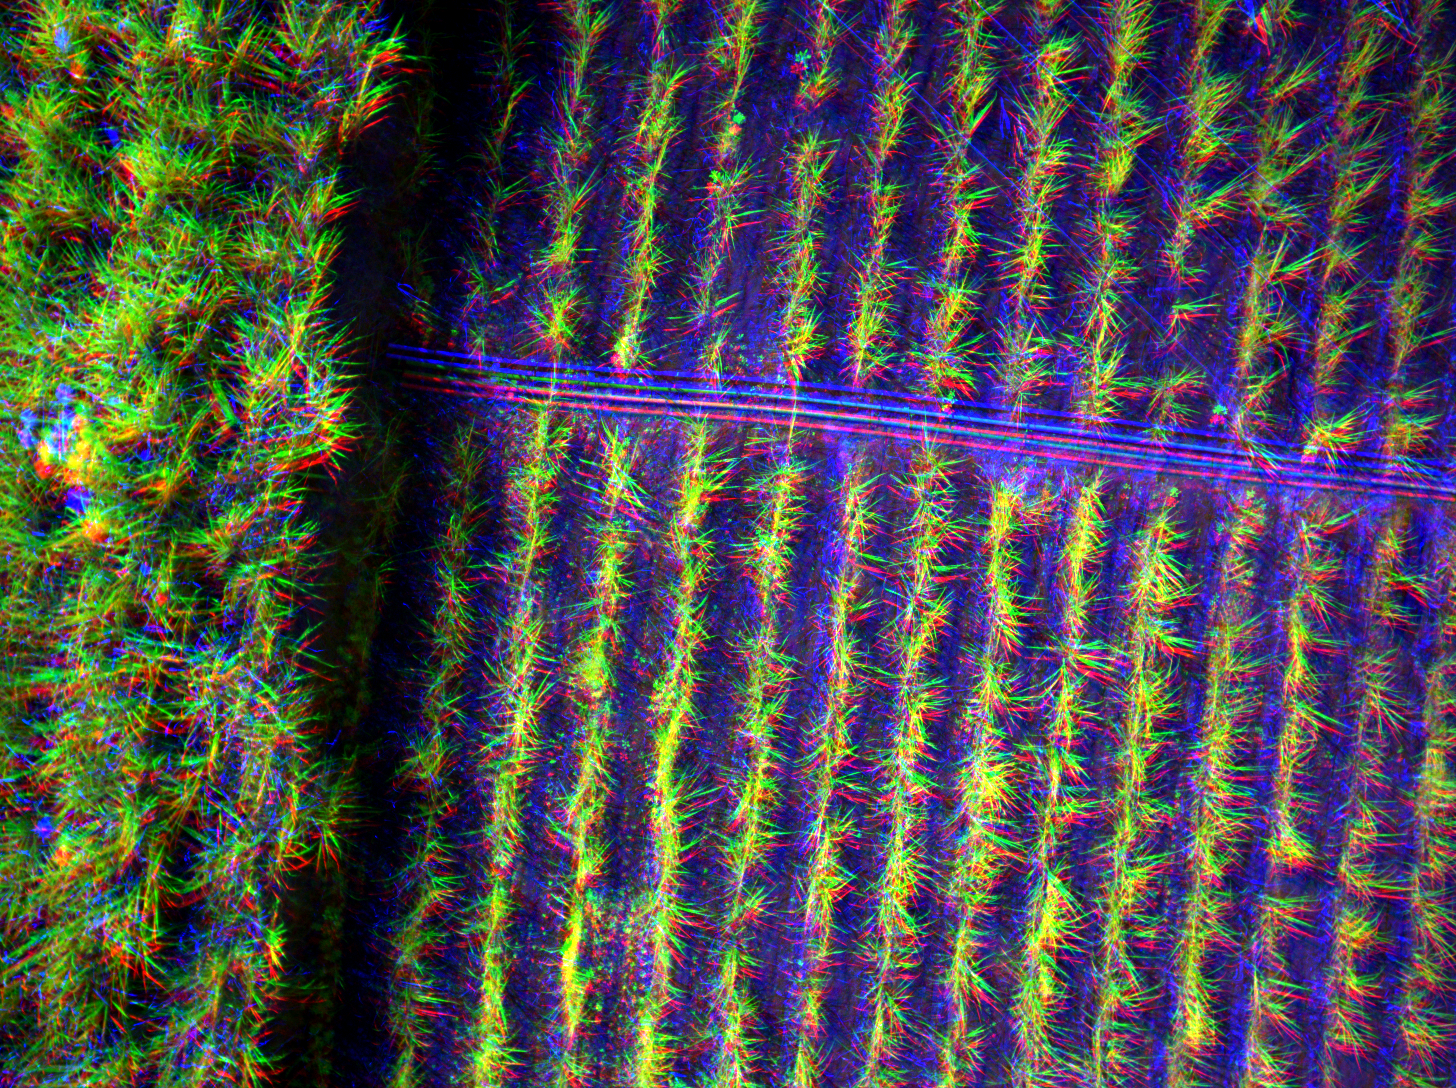
🎨 Band Composites (Sample Capture)
True Color (RGB)
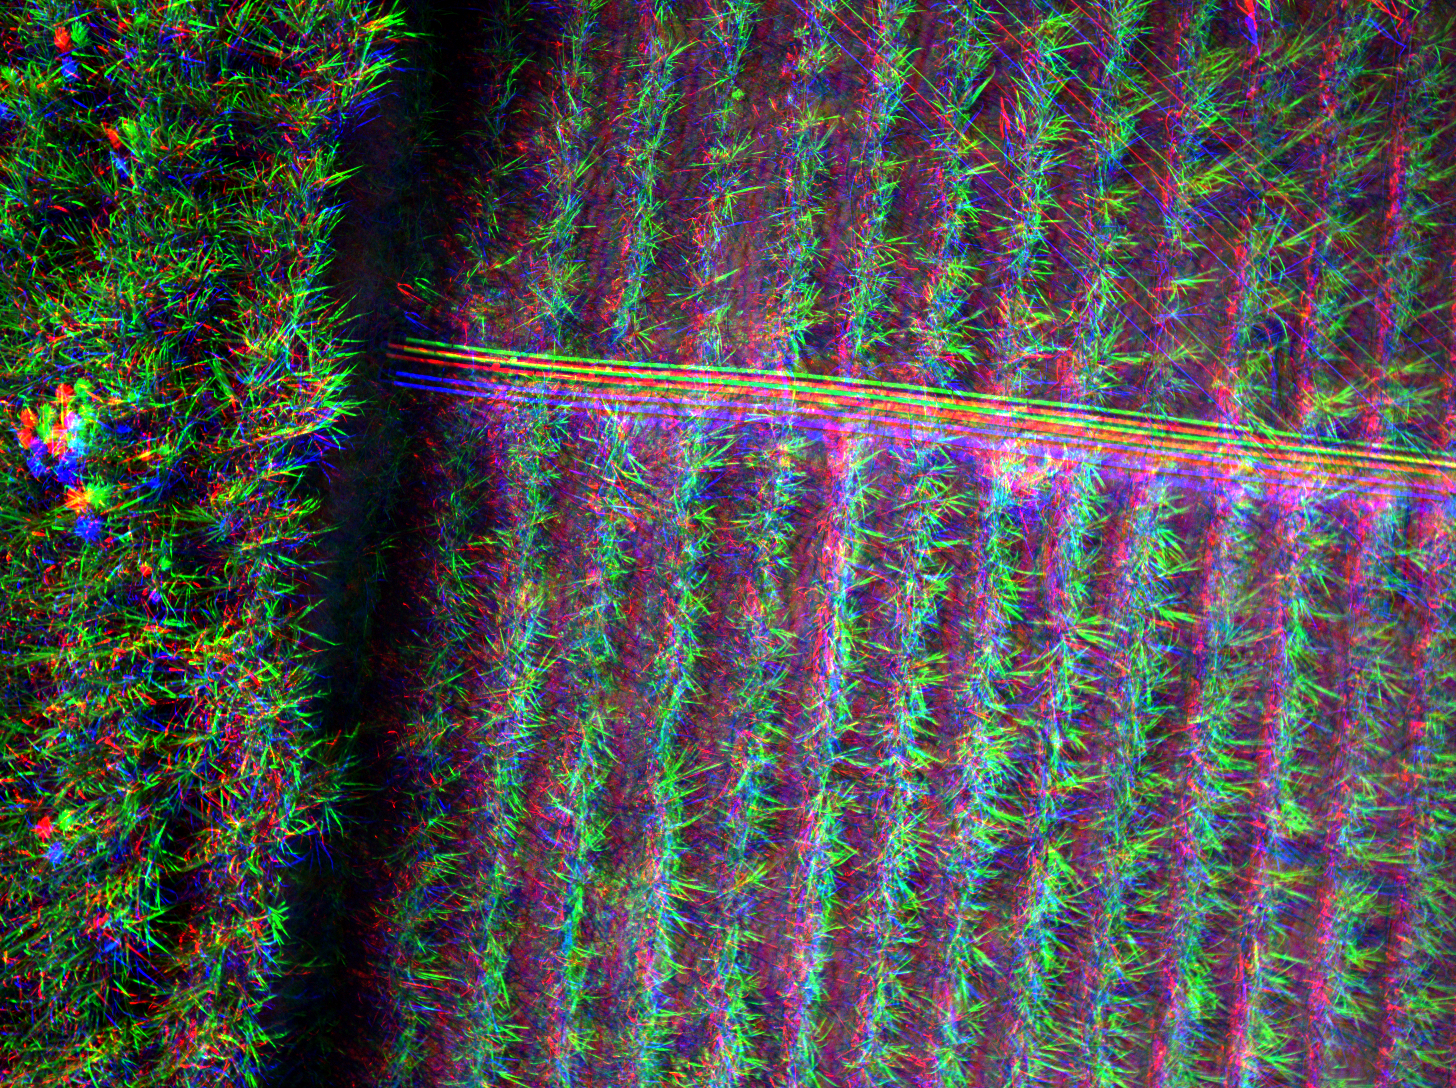
False Color (NIR-RE-R)
📊 Vegetation Index Analysis
| Index | Min | Max | Mean | Std Dev | Median |
|---|---|---|---|---|---|
| NDVI | 0.4911 | 0.5561 | 0.5214 | 0.0206 | 0.5230 |
| SAVI | 0.2538 | 0.3497 | 0.3290 | 0.0191 | 0.3350 |
| MSAVI2 | 0.2285 | 0.3342 | 0.3111 | 0.0212 | 0.3176 |
| OSAVI | 0.3033 | 0.3714 | 0.3546 | 0.0134 | 0.3556 |
| RVI | 3.2782 | 4.3852 | 3.7992 | 0.3796 | 3.8521 |
| DVI | 0.1385 | 0.2335 | 0.2074 | 0.0190 | 0.2118 |
| TVI | 0.9935 | 1.0250 | 1.0082 | 0.0099 | 1.0088 |
| NDRE | -0.1641 | -0.0269 | -0.0749 | 0.0339 | -0.0673 |
| CHL_Index | -0.1655 | 0.1662 | 0.0622 | 0.0702 | 0.0796 |
| GNDVI | 0.2190 | 0.2936 | 0.2400 | 0.0168 | 0.2351 |
| NDWI | -0.2936 | -0.2190 | -0.2400 | 0.0168 | -0.2351 |
| EVI | -2.5231 | 1.6724 | 0.4422 | 0.4108 | 0.4686 |
| SIPI | 0.9337 | 1.0134 | 0.9785 | 0.0217 | 0.9757 |
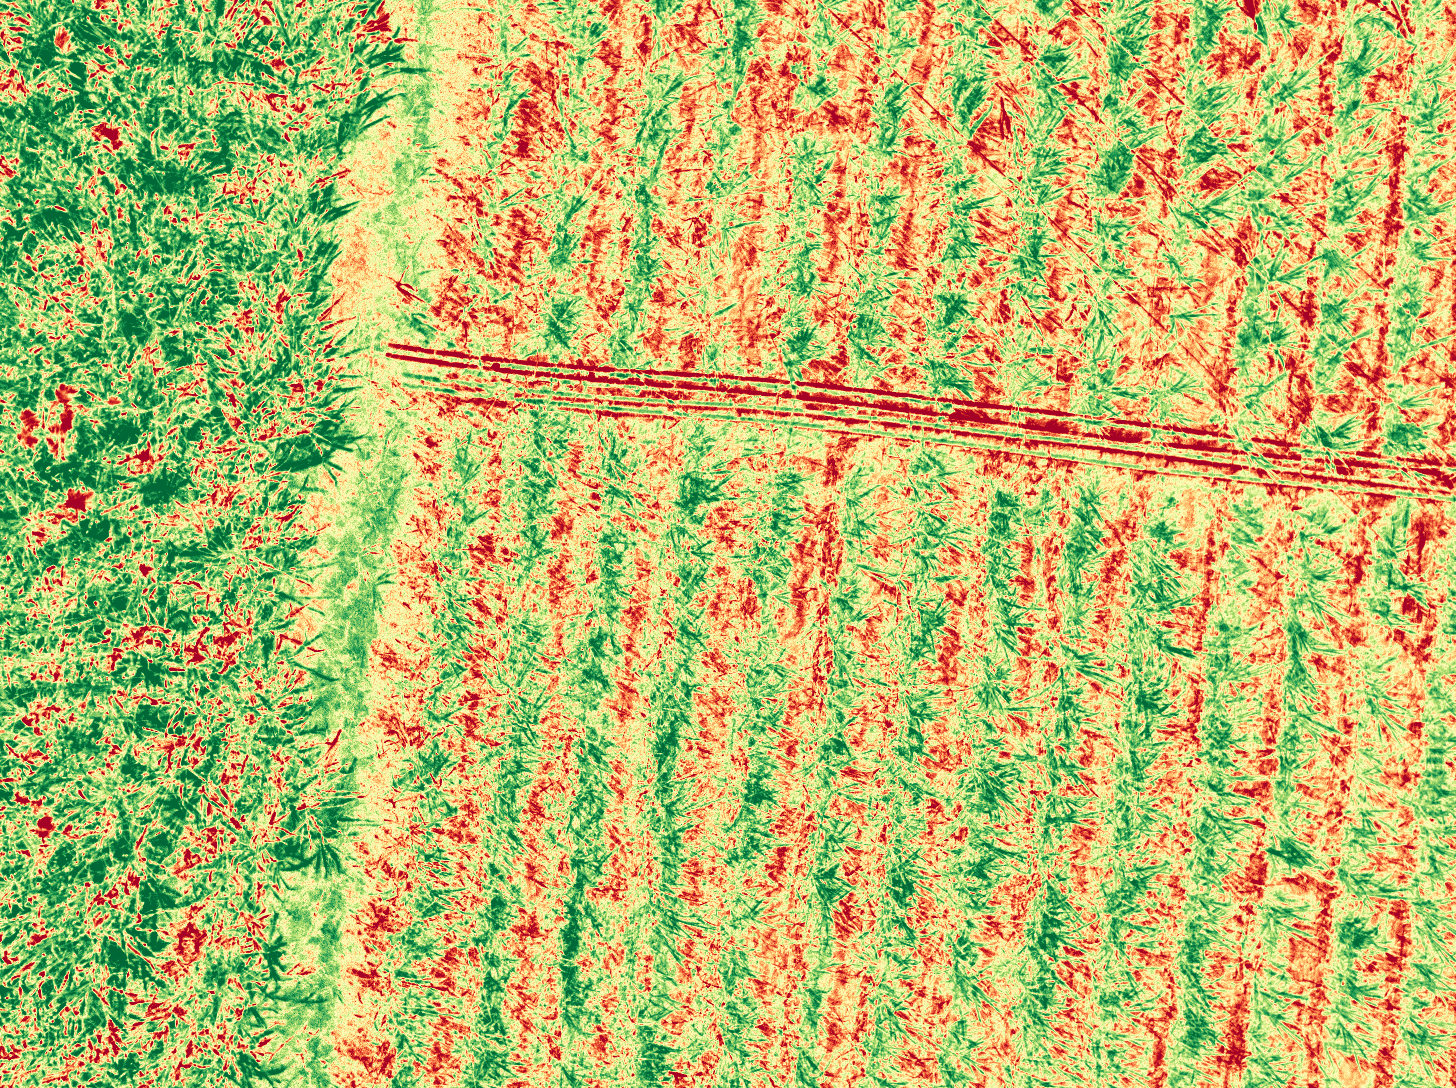
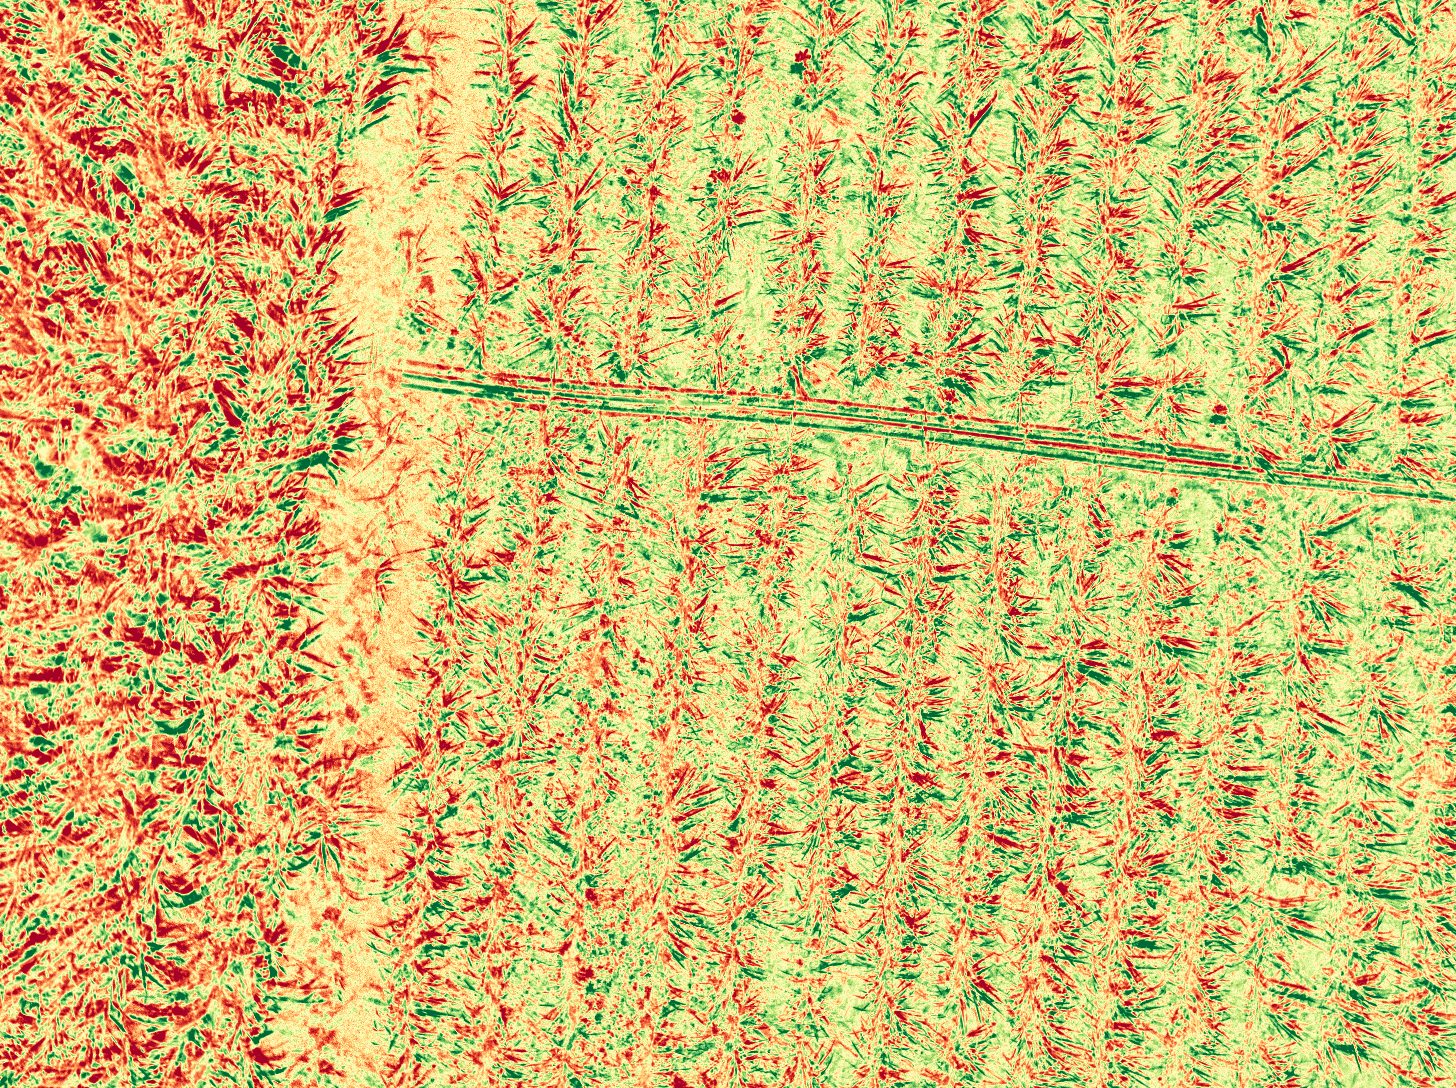
🌈 Index Visualizations (Sample Capture)
NDVI
NDRE
NDWI
📜 Expert Agronomic Analysis
Based on comprehensive multispectral data analysis of RGB, False Color, NDVI, and statistical trends.
💡 Precision Agronomic Strategy
The report shows the field as "Healthy" because statistically, your Sugar Cane is doing well for its current age. However, the purpose of this precision pipeline is to move beyond "blanket" assessments. The AI is recommending intervention in these 5 zones to maximize yield potential by ensuring the entire field matures at the same rate.
Executive Summary
Precision drone analysis identified 2,938 sq.ft of weed encroachment and 2,013 sq.ft of nutrient deficiency that were entirely omitted by satellite reports due to low spatial resolution. Despite a '100% Healthy' satellite classification, we have identified a 1.09% (500 sq.ft) risk of pest/disease and 1.39% (636 sq.ft) water stress. Highly-targeted application of Urea and selective herbicides is required in localized zones (primarily captures IMG_0116 and IMG_0081) to ensure the field reaches uniform maturity and maximum sucrose content.
🌱 Vegetation Health Analysis
Overall Vigor: Overall vigor is moderate-to-high with a peak NDVI of 0.5561. However, the standard deviation of 0.0206 in NDVI masked by the satellite's average shows significant intra-row variability. The DVI (0.2074) confirms that photosynthetic activity is concentrated in the central rows, while the margins show relative thinning.
Chlorophyll Content: The CHL_Index mean of 0.0622 and NDRE mean of -0.0749 indicate a marginal nitrogen deficit in the newer leaf tissue. The discrepancy between NDVI (biomass) and NDRE (chlorophyll) suggests the crop is producing leaf area faster than it is assimilating nitrogen, a common precursor to growth stagnation in sugarcane.
Uniformity: The field exhibits systematic uniformity in planting patterns but spectral patchiness. The variation between the 5th percentile (0.4948) and 95th percentile (0.5499) for NDVI highlights a 10% vigor gap that requires precision leveling to prevent harvest-time yield loss.
⚠️ Stress & Anomalies
| Identified Issue | Evidence | Severity |
|---|---|---|
| Nitrogen Deficiency Gradient | GNDVI (0.24) and NDRE (-0.0749) are significantly lower than the NDVI (0.5214), pointing to a lack of nitrogen relative to biomass. | Medium |
| Weed Encroachment in Inter-rows | GIS parameters identify 2,938 sq.ft of weeds. Visual RGB/False Color show high-frequency spectral noise between cane rows. | High |
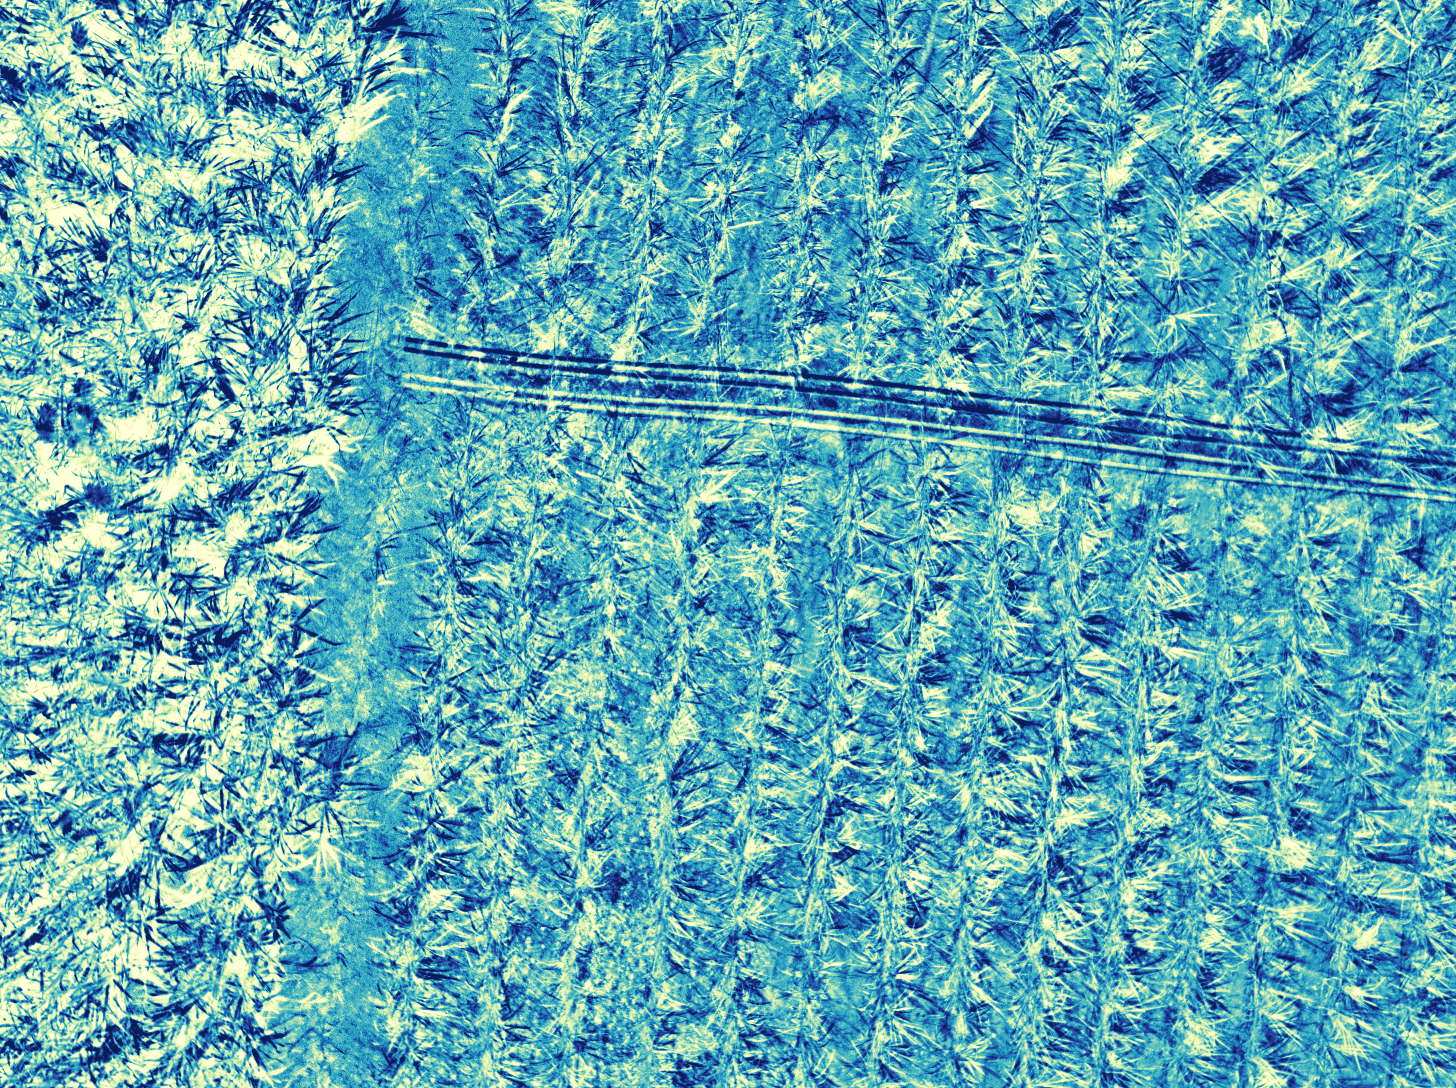
| Irrigation Lateral Artifact | Linear high-reflectance signature in the center of the heatmaps disrupting the crop canopy. | Low |
🏗️ Infrastructure & Non-Crop Objects
| Object Type | Description & Location |
|---|---|
| Irrigation Lateral / Pipe Track | A horizontal linear structure is visible across the center-right of the field, causing a physical gap in the cane and showing high reflectance in NDVI/NDRE heatmaps. |
| Bare Soil Inter-rows | Visible between the sugarcane stalks, contributing to the lower SAVI values compared to NDVI. |
🚁 Targeted Spraying Prescription
| Treatment/Chemical | Dosage/Qty | Target Area | Agronomic Reasoning |
|---|---|---|---|
| Urea Nitrogen Fertilizer (46% N) Liquid Foliar | 45kg/ha (dissolved in 200L/ha water) | 2,013 sq.ft localized zones in the northern sector (Capture IMG_0081 and IMG_0116) | To correct the nitrogen deficit indicated by low NDRE and GNDVI values. |
| Atrazine Herbicide (Selective) | 1.5L/ha | 2,938 sq.ft inter-row spaces | To eliminate broadleaf and grass weed competition detected in the 6.42% weed-affected area. |
✅ Actionable Recommendations
- Conduct a targeted soil nitrate test in the 2,013 sq.ft zone identified for nutrient loss.
- Increase irrigation frequency by 15% in the 636 sq.ft water-stressed zone for the next 7 days.
- Deploy a scout to the 500 sq.ft pest-risk area to confirm aphid presence before blanket spraying.
- Schedule a precision herbicide application for the 2,938 sq.ft weed-infested area to prevent competition for nutrients.
🌊 Canopy Hydration Analysis (NDWI)
Canopy Hydration: The NDWI mean of -0.24 and the maximum of -0.219 indicate that the canopy is currently transpiring heavily. A specific zone of 636 sq.ft is exhibiting critical water stress where NDWI drops towards the -0.29 range, signifying a localized irrigation blockage or soil drainage issue.
Irrigation Uniformity: Visual evidence from Image 5 (NDWI Heatmap) shows a linear artifact across the field, likely representing the primary irrigation lateral or a structural path. The surrounding vegetation shows higher hydration, but the periphery is beginning to exhibit moisture-deficit signatures.
Moisture Zone Distribution:
🐛 Pest & Disease Risk Assessment (NDRE/SIPI)
Risk Assessment: Low to Medium. The 500 sq.ft (1.09%) designated as pest/disease risk corresponds to areas with suppressed NDRE and elevated SIPI, which are typical signatures of early Sugarcane Aphid (Melanaphis sacchari) infestation or localized Red Rot (Colletotrichum falcatum) onset.
Suspected Pathogens/Pests: Targeted monitoring is required for Sugarcane Aphids and Whitefly, specifically where the NDRE values are at their minimum (-0.1641).
Pest Risk Zone Distribution:
📋 Flight Settings & Checklist
⚙️ Flight Parameters
| Target Altitude (AGL) | 40 m |
| Target GSD (Resolution) | 1.2 cm/px |
| Overlap Settings | 80% Forward, 75% Side overlap for orthomosaic generation. |
| Optimal Flight Timing | Best captured between 10:00 AM and 2:00 PM to minimize shadows. |
💡 Weed Identification Flight Guide
To identify individual weeds, flight altitude must be lowered to 30-40 meters AGL to achieve sub-centimeter GSD. False Color and NIR bands should be analyzed to distinguish weed spectral signatures from sugar cane.
📋 Preflight Checklist
- Wipe clean all 5 spectral lenses and the panchromatic lens.
- Capture radiometric calibration panel images before and after flight.
- Ensure DLS2 (Downwelling Light Sensor) is completely unobstructed.
- Verify RTK GPS fix or wait for 3D GPS lock with at least 15 satellites.
🔍 Stitched Real Field & Multispectral Orthomosaics
High-resolution stitched RGB true-color orthomosaic alongside analytical NDVI, NDRE, and NDWI heatmaps. We have added Pansharpened RGB (Brovey Transform) and Panchromatic Grayscale layers to produce ultra-sharp imagery. Use the interactive GIS map below to toggle layers and view the exact, color-coded precision intervention zones (Urea Spray, Drip Irrigation, Weed Spot-Treatments, Pest Spray) designed for direct action.
💡 Scroll to zoom, drag to pan, and toggle layers using the menu on the top right.
Low NDRE. Requires Nitrogen boost.
High NDWI. Requires irrigation increase.
High NDVI. Requires spot-herbicide spray.
Low NDRE / High SIPI. Requires pest control.
📷 Camera & Flight Information
| Camera Model | RedEdge-P |
| Serial Number | PR01-2145023-MS |
| Firmware | v1.3.2 |
| Flight Date | 2025:12:17 08:42:41 |
| Altitude (avg) | 612.8 m |
| Spectral Bands | Blue (475nm), Green (560nm), Red (668nm), RedEdge (717nm), NIR (842nm), Panchromatic |
| Sensor Resolution | 1456×1088 (MS) / 2464×2056 (Pan) |
| GPS Bounds | 16.974145°N to 16.974241°N, 74.328769°E to 74.329412°E |
| Total Images | 480 (80 captures × 6 bands) |