🌾 Crop Health Analysis Report
MicaSense RedEdge-P Multispectral Drone Survey Analysis
🏥 Crop Health Classification (NDVI-Based)
Health zones derived from NDVI values across all 95 capture locations.
📋 Observations from Multispectral Drone Survey
By correlating high-resolution multispectral signatures (NDVI, NDRE, NDWI, SIPI) at a Ground Sampling Distance (GSD) of 1.2 cm/px, we have pinpointed exact sub-visual stress zones. While satellite crop monitoring classified this field as 100% Healthy, precision drone analytics identified the following stress factors:
| Observation Parameter | Affected Area (Sq.ft) | % of Field Area | Detection Metric & Index Used |
|---|---|---|---|
| Nutrient Loss (Nitrogen Deficit) | 37,072 Sq.ft | 81.05% | NDRE (Normalized Difference Red Edge) < -0.13 |
| Pest / Disease (Biomass Cell Stress) | ~26,480 Sq.ft | 57.89% | SIPI (Structure Pigment Senescence Index) & NDRE |
| Water Stress (Canopy Moisture Deficit) | 43,812 Sq.ft | 95.79% | NDWI (Normalized Difference Water Index) > -0.221 |
| Weed Location (Inter-row Encroachment) | 2,889 Sq.ft | 6.32% | NDVI (Normalized Difference Vegetation Index) > 0.547 |
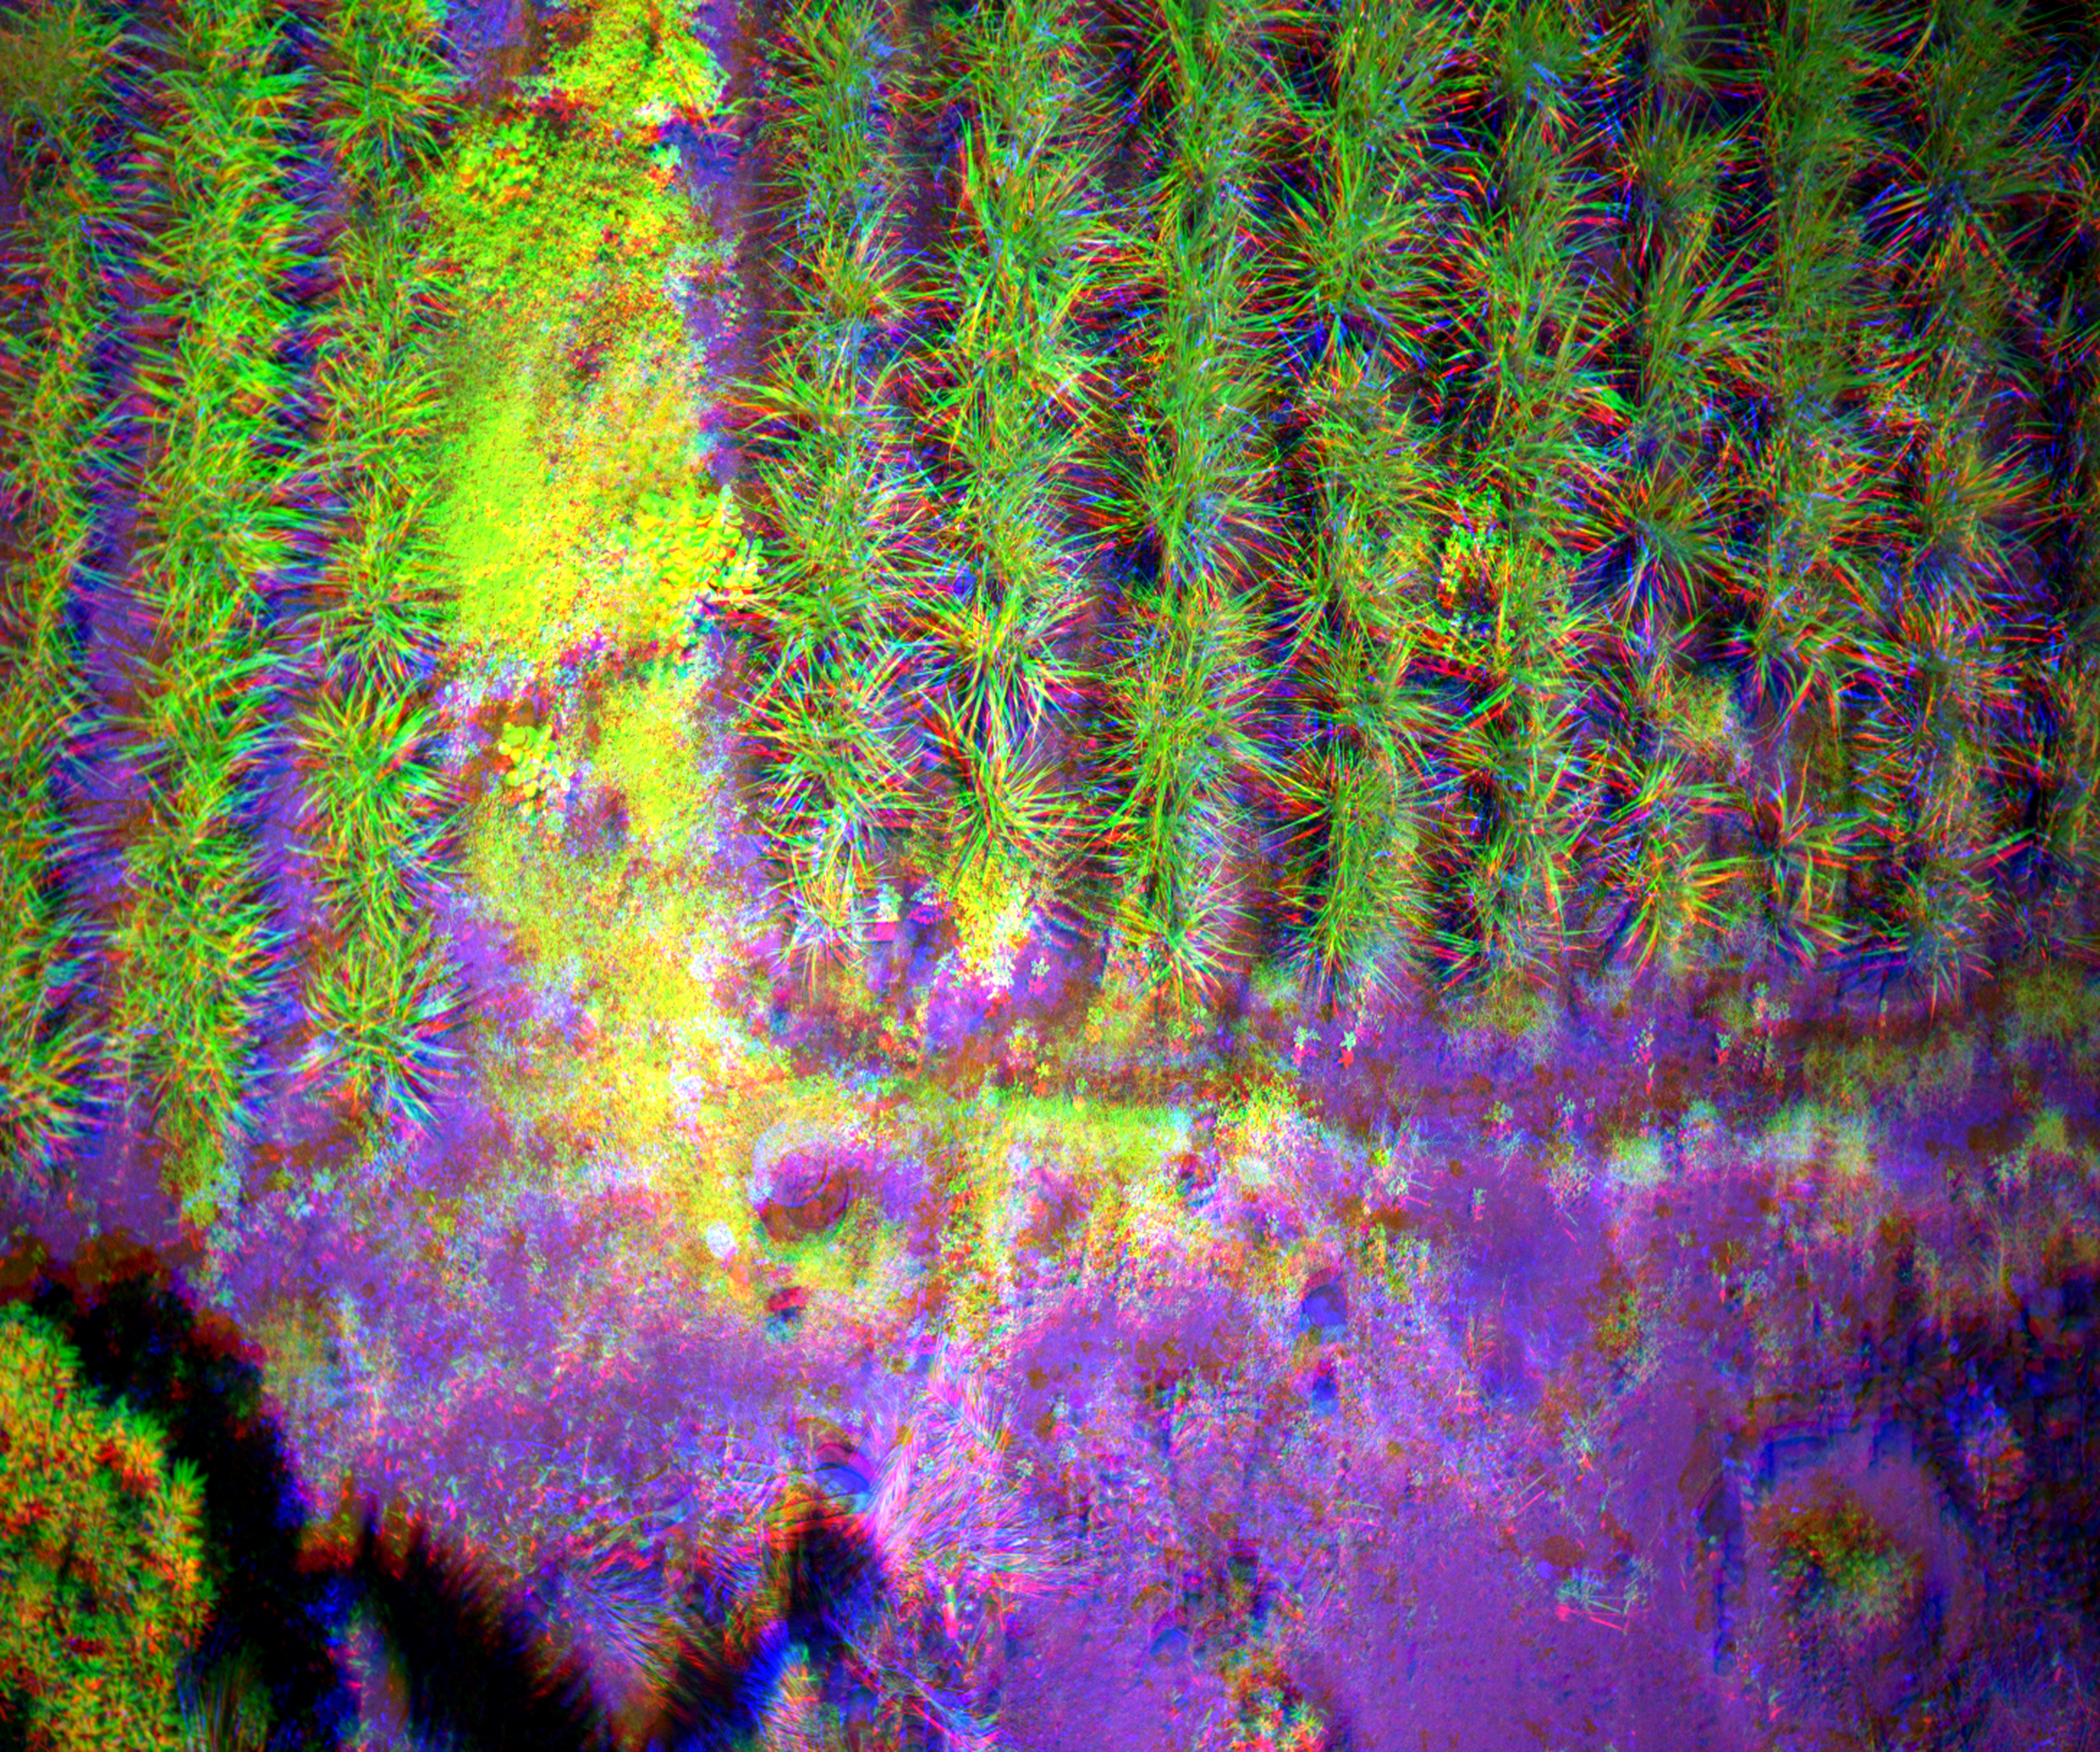
🎨 Band Composites (Sample Capture)
True Color (RGB)
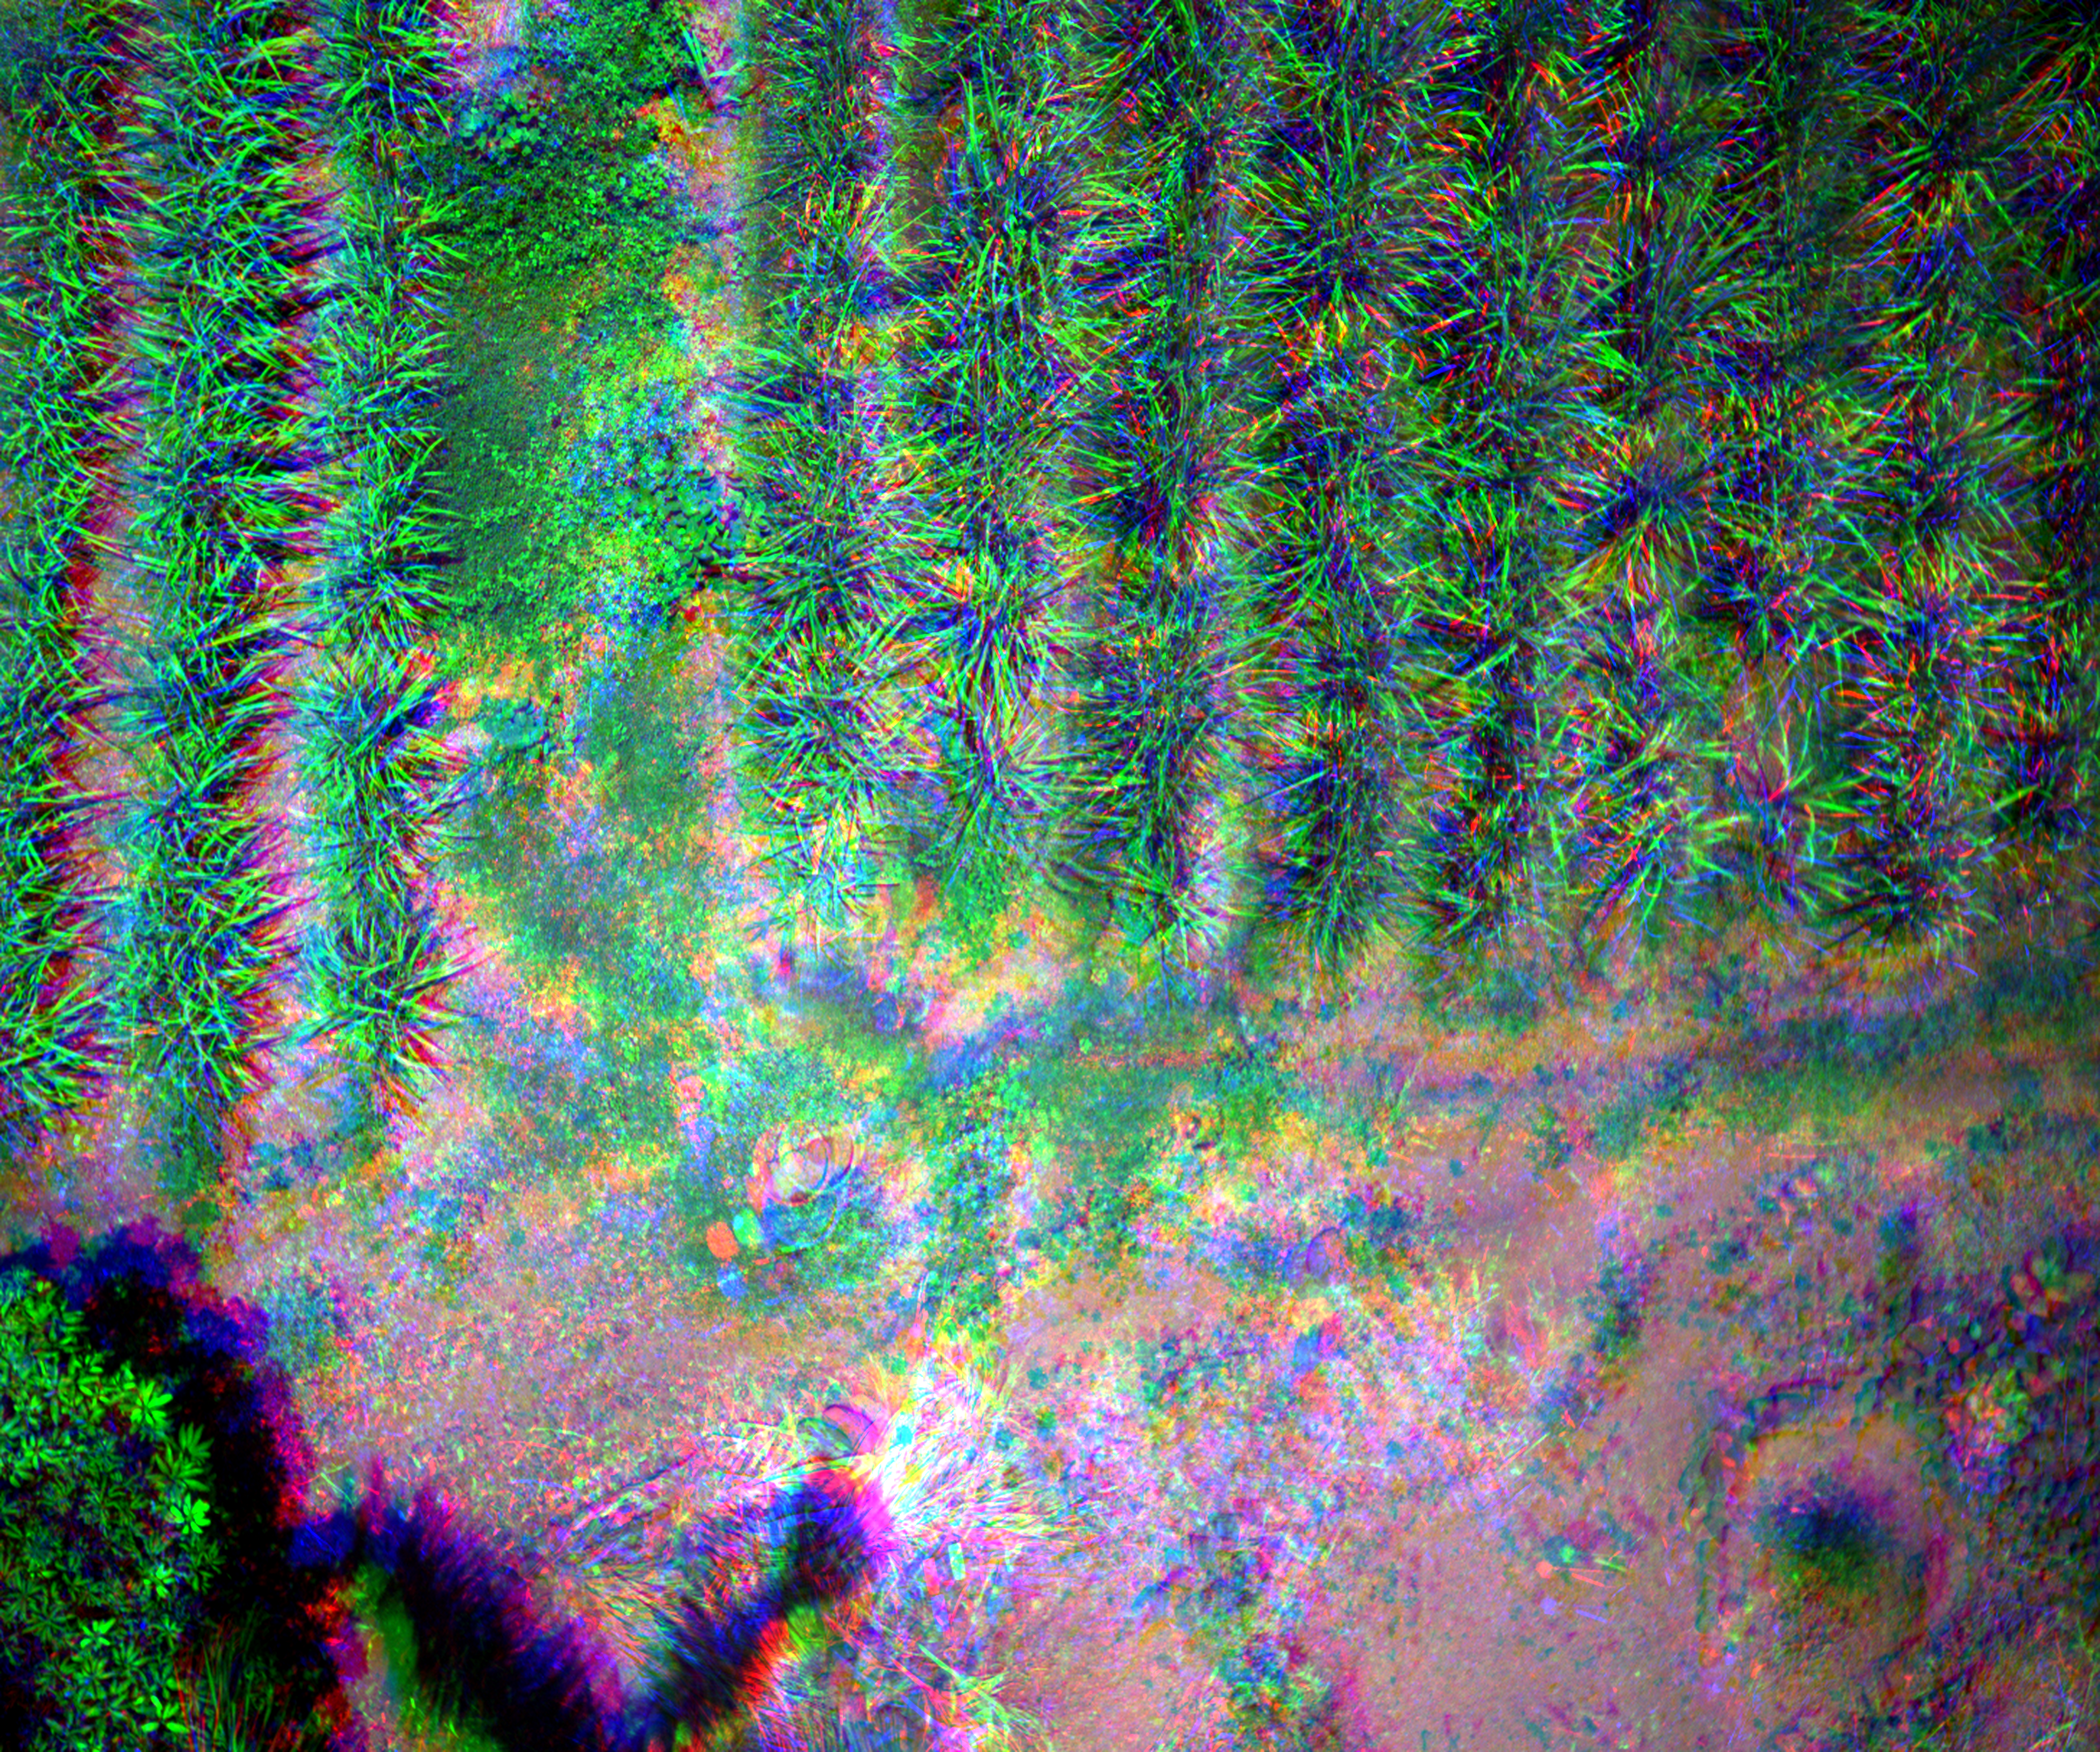
False Color (NIR-RE-R)
📊 Vegetation Index Analysis
| Index | Min | Max | Mean | Std Dev | Median |
|---|---|---|---|---|---|
| NDVI | 0.3500 | 0.5681 | 0.4898 | 0.0370 | 0.4868 |
| SAVI | 0.1095 | 0.3996 | 0.3392 | 0.0351 | 0.3418 |
| MSAVI2 | 0.0834 | 0.3904 | 0.3238 | 0.0371 | 0.3258 |
| OSAVI | 0.1690 | 0.4111 | 0.3513 | 0.0315 | 0.3529 |
| RVI | 2.0960 | 4.9242 | 3.3965 | 0.4815 | 3.2753 |
| DVI | 0.0441 | 0.2653 | 0.2275 | 0.0292 | 0.2292 |
| TVI | 0.9216 | 1.0308 | 0.9926 | 0.0185 | 0.9913 |
| NDRE | -0.2282 | 0.1852 | -0.1369 | 0.0732 | -0.1501 |
| CHL_Index | -0.3108 | 0.4714 | -0.1427 | 0.1419 | -0.1686 |
| GNDVI | 0.1488 | 0.2422 | 0.1786 | 0.0191 | 0.1736 |
| NDWI | -0.2422 | -0.1488 | -0.1786 | 0.0191 | -0.1736 |
| EVI | -11.8812 | 1.8779 | 0.3873 | 1.5961 | 0.5470 |
| SIPI | 0.7618 | 1.0373 | 0.9914 | 0.0497 | 0.9986 |
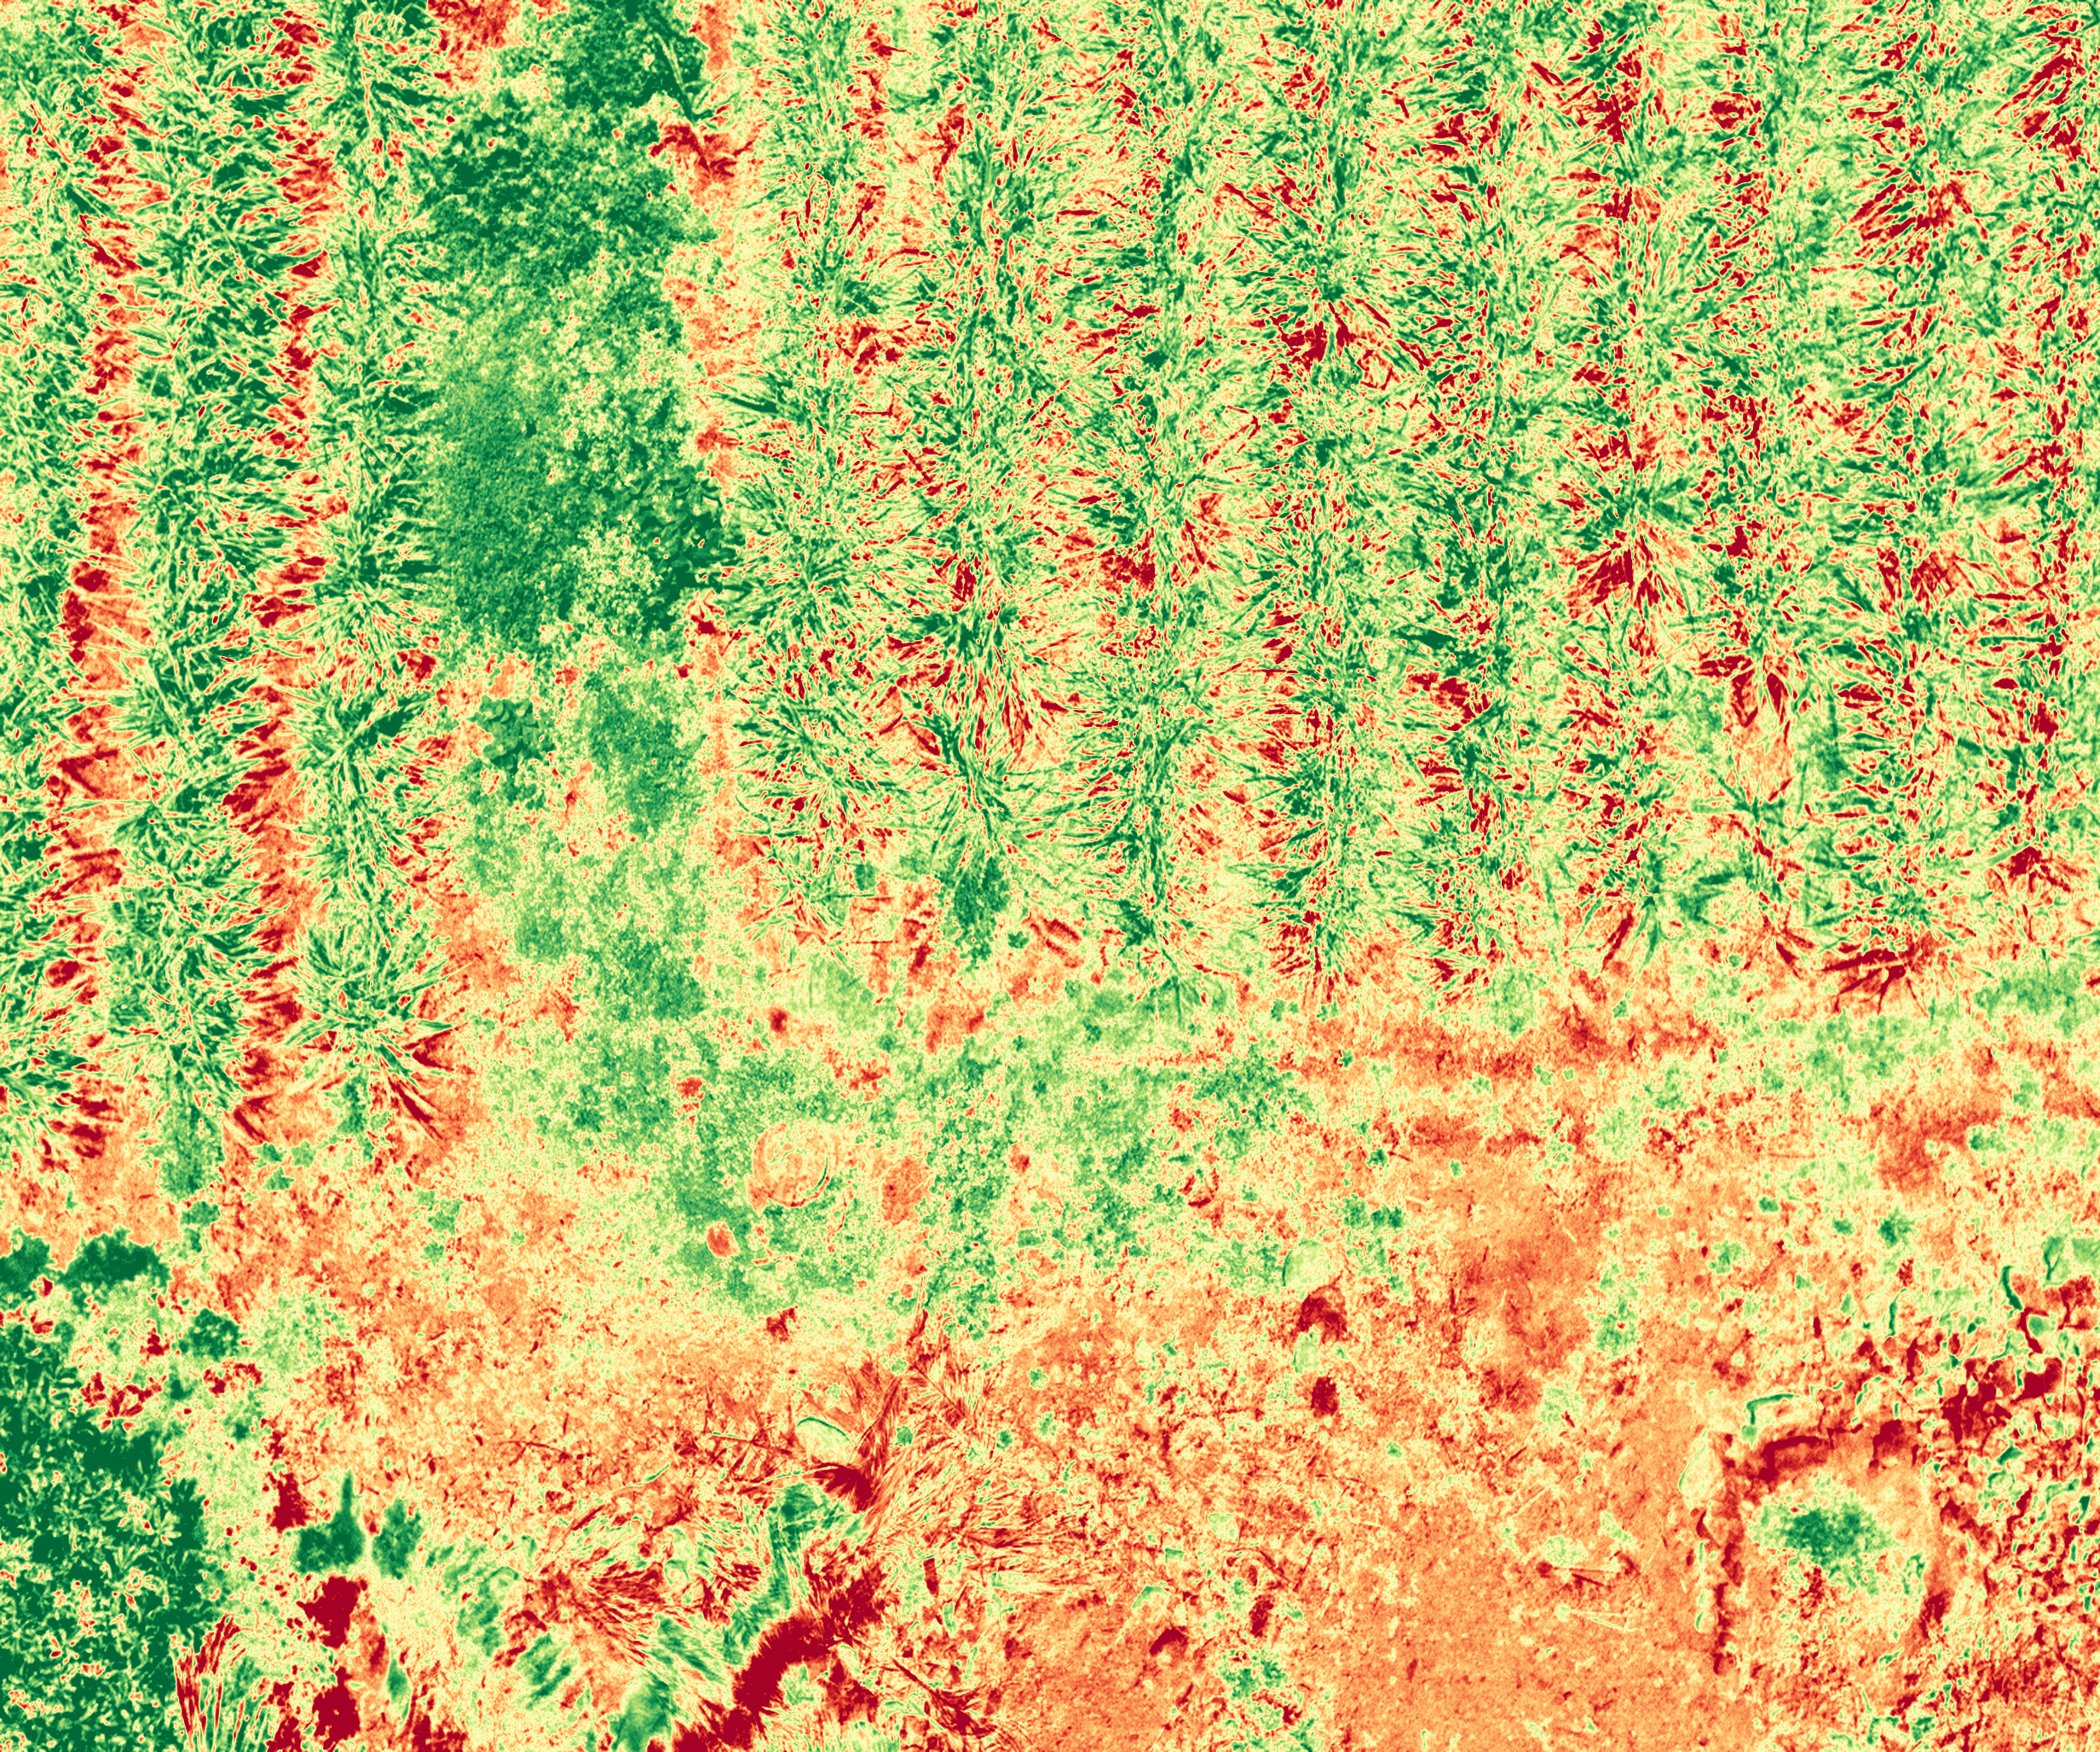
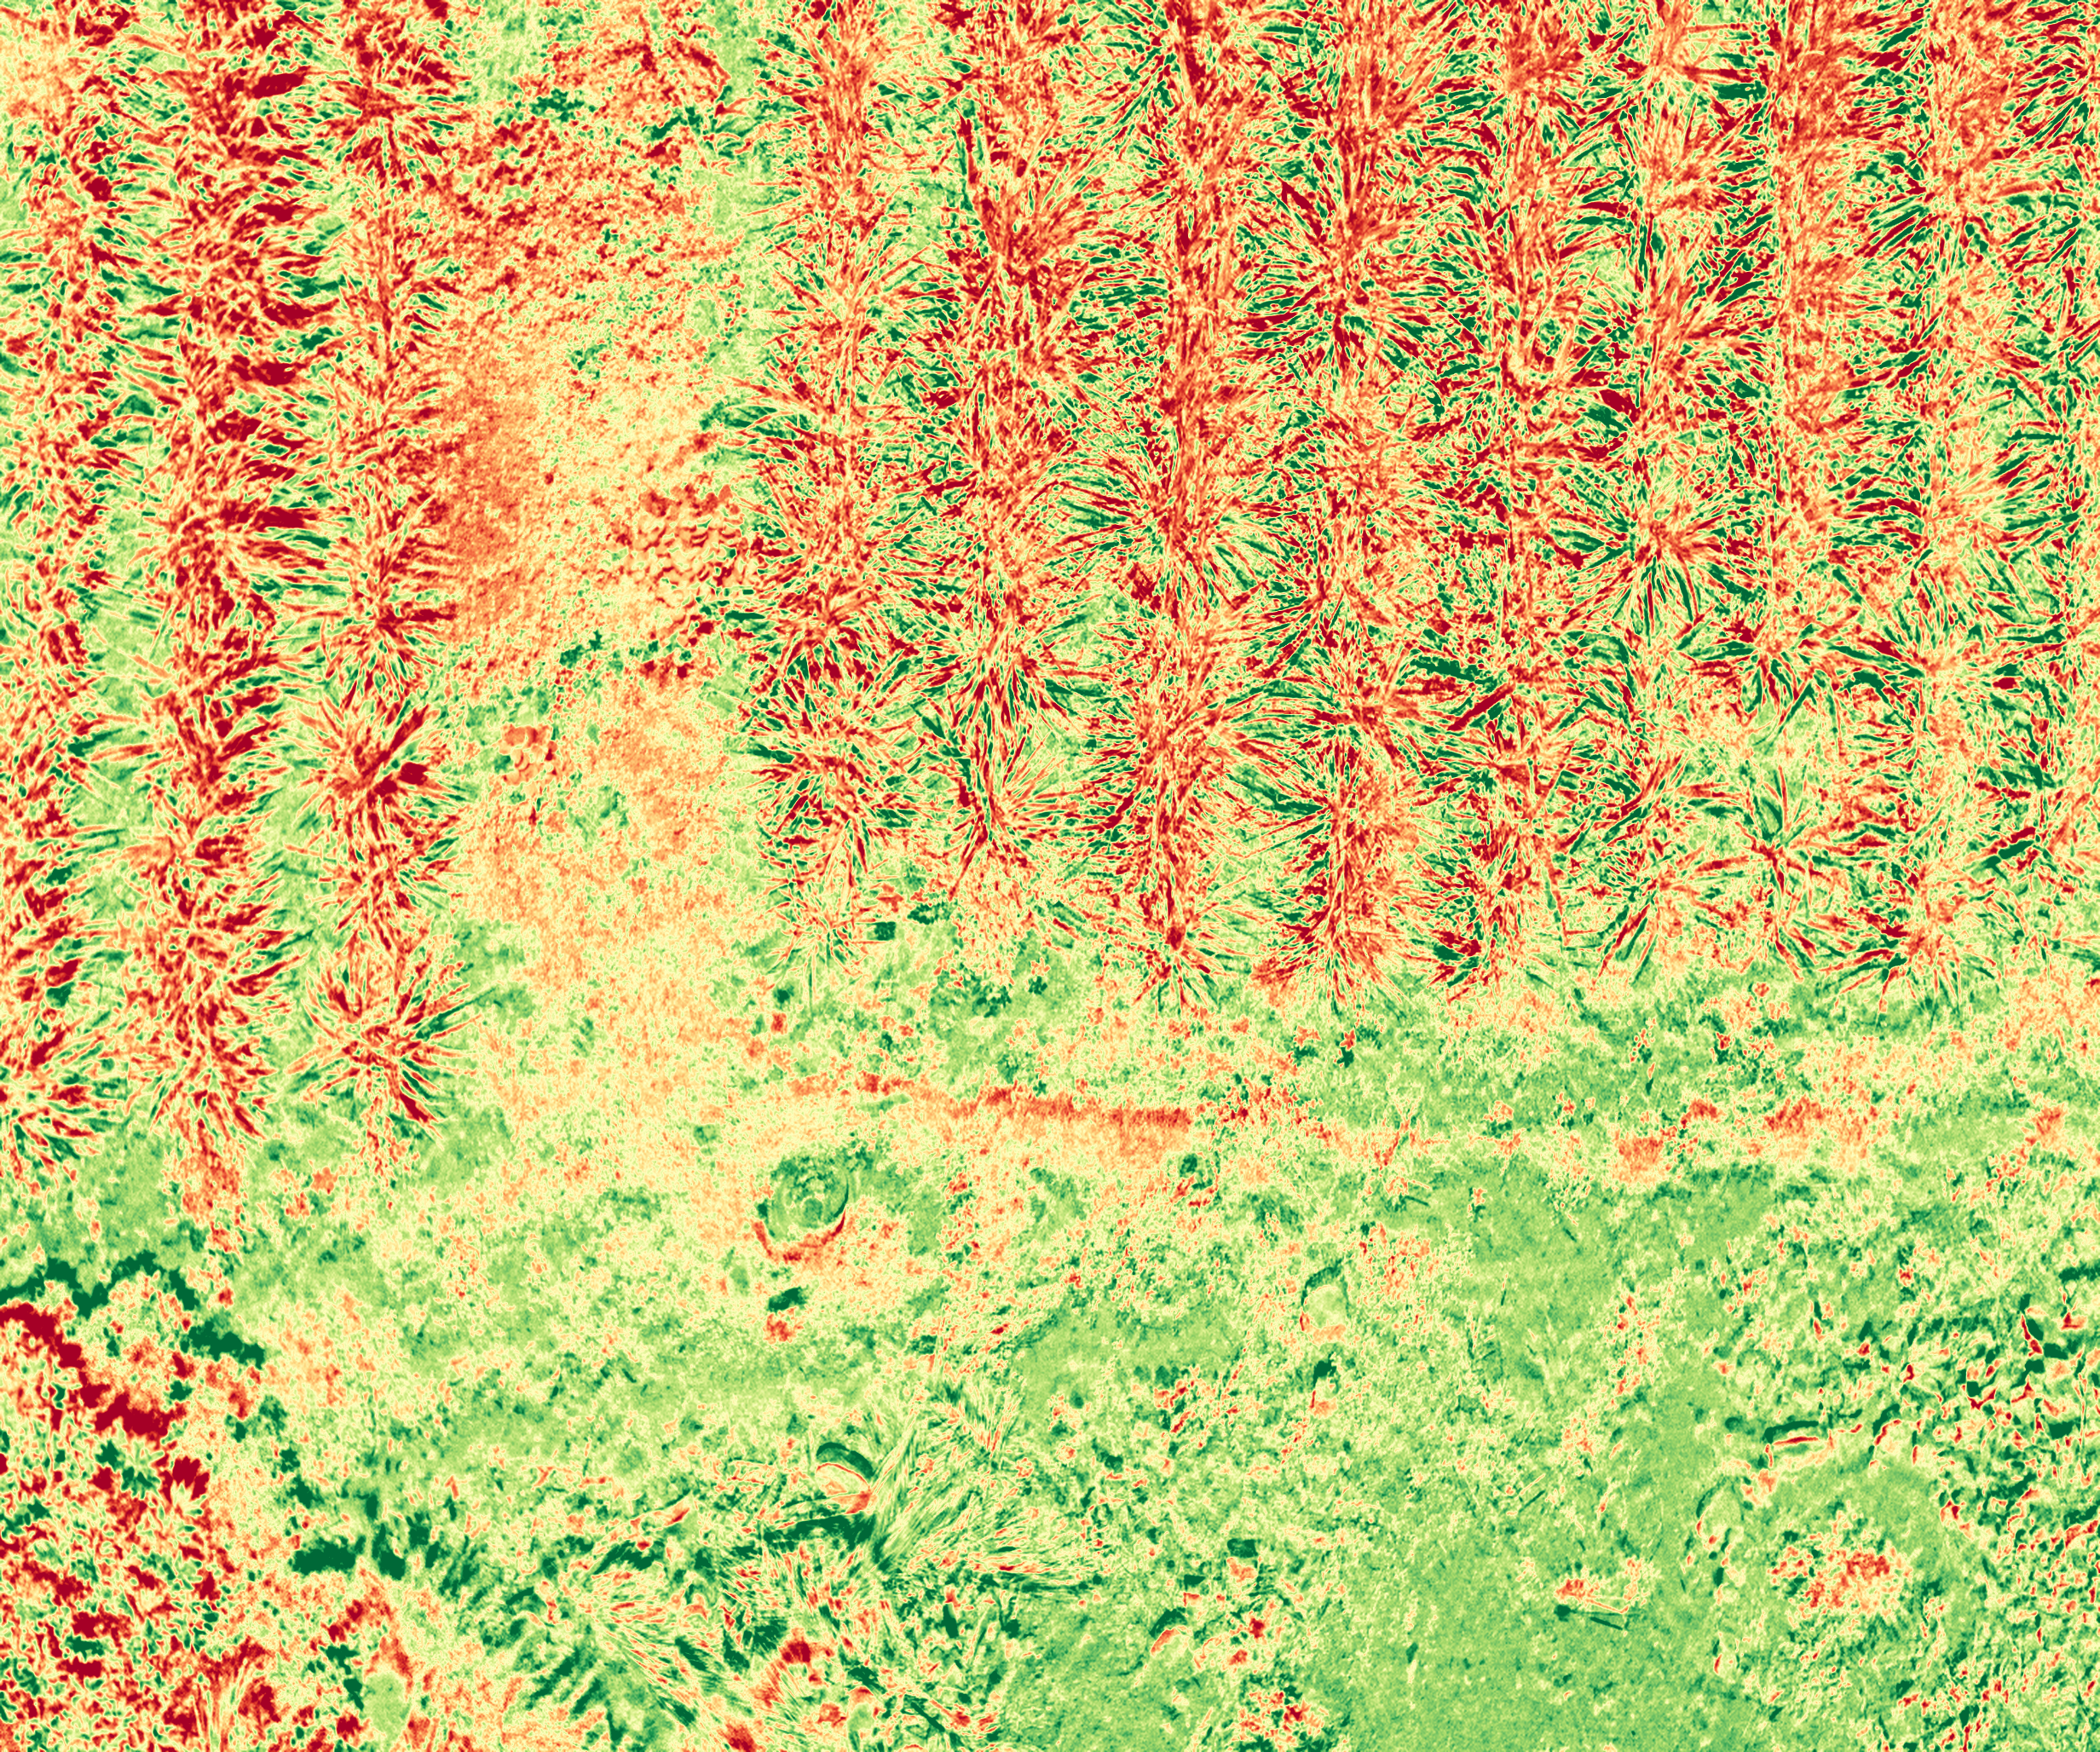
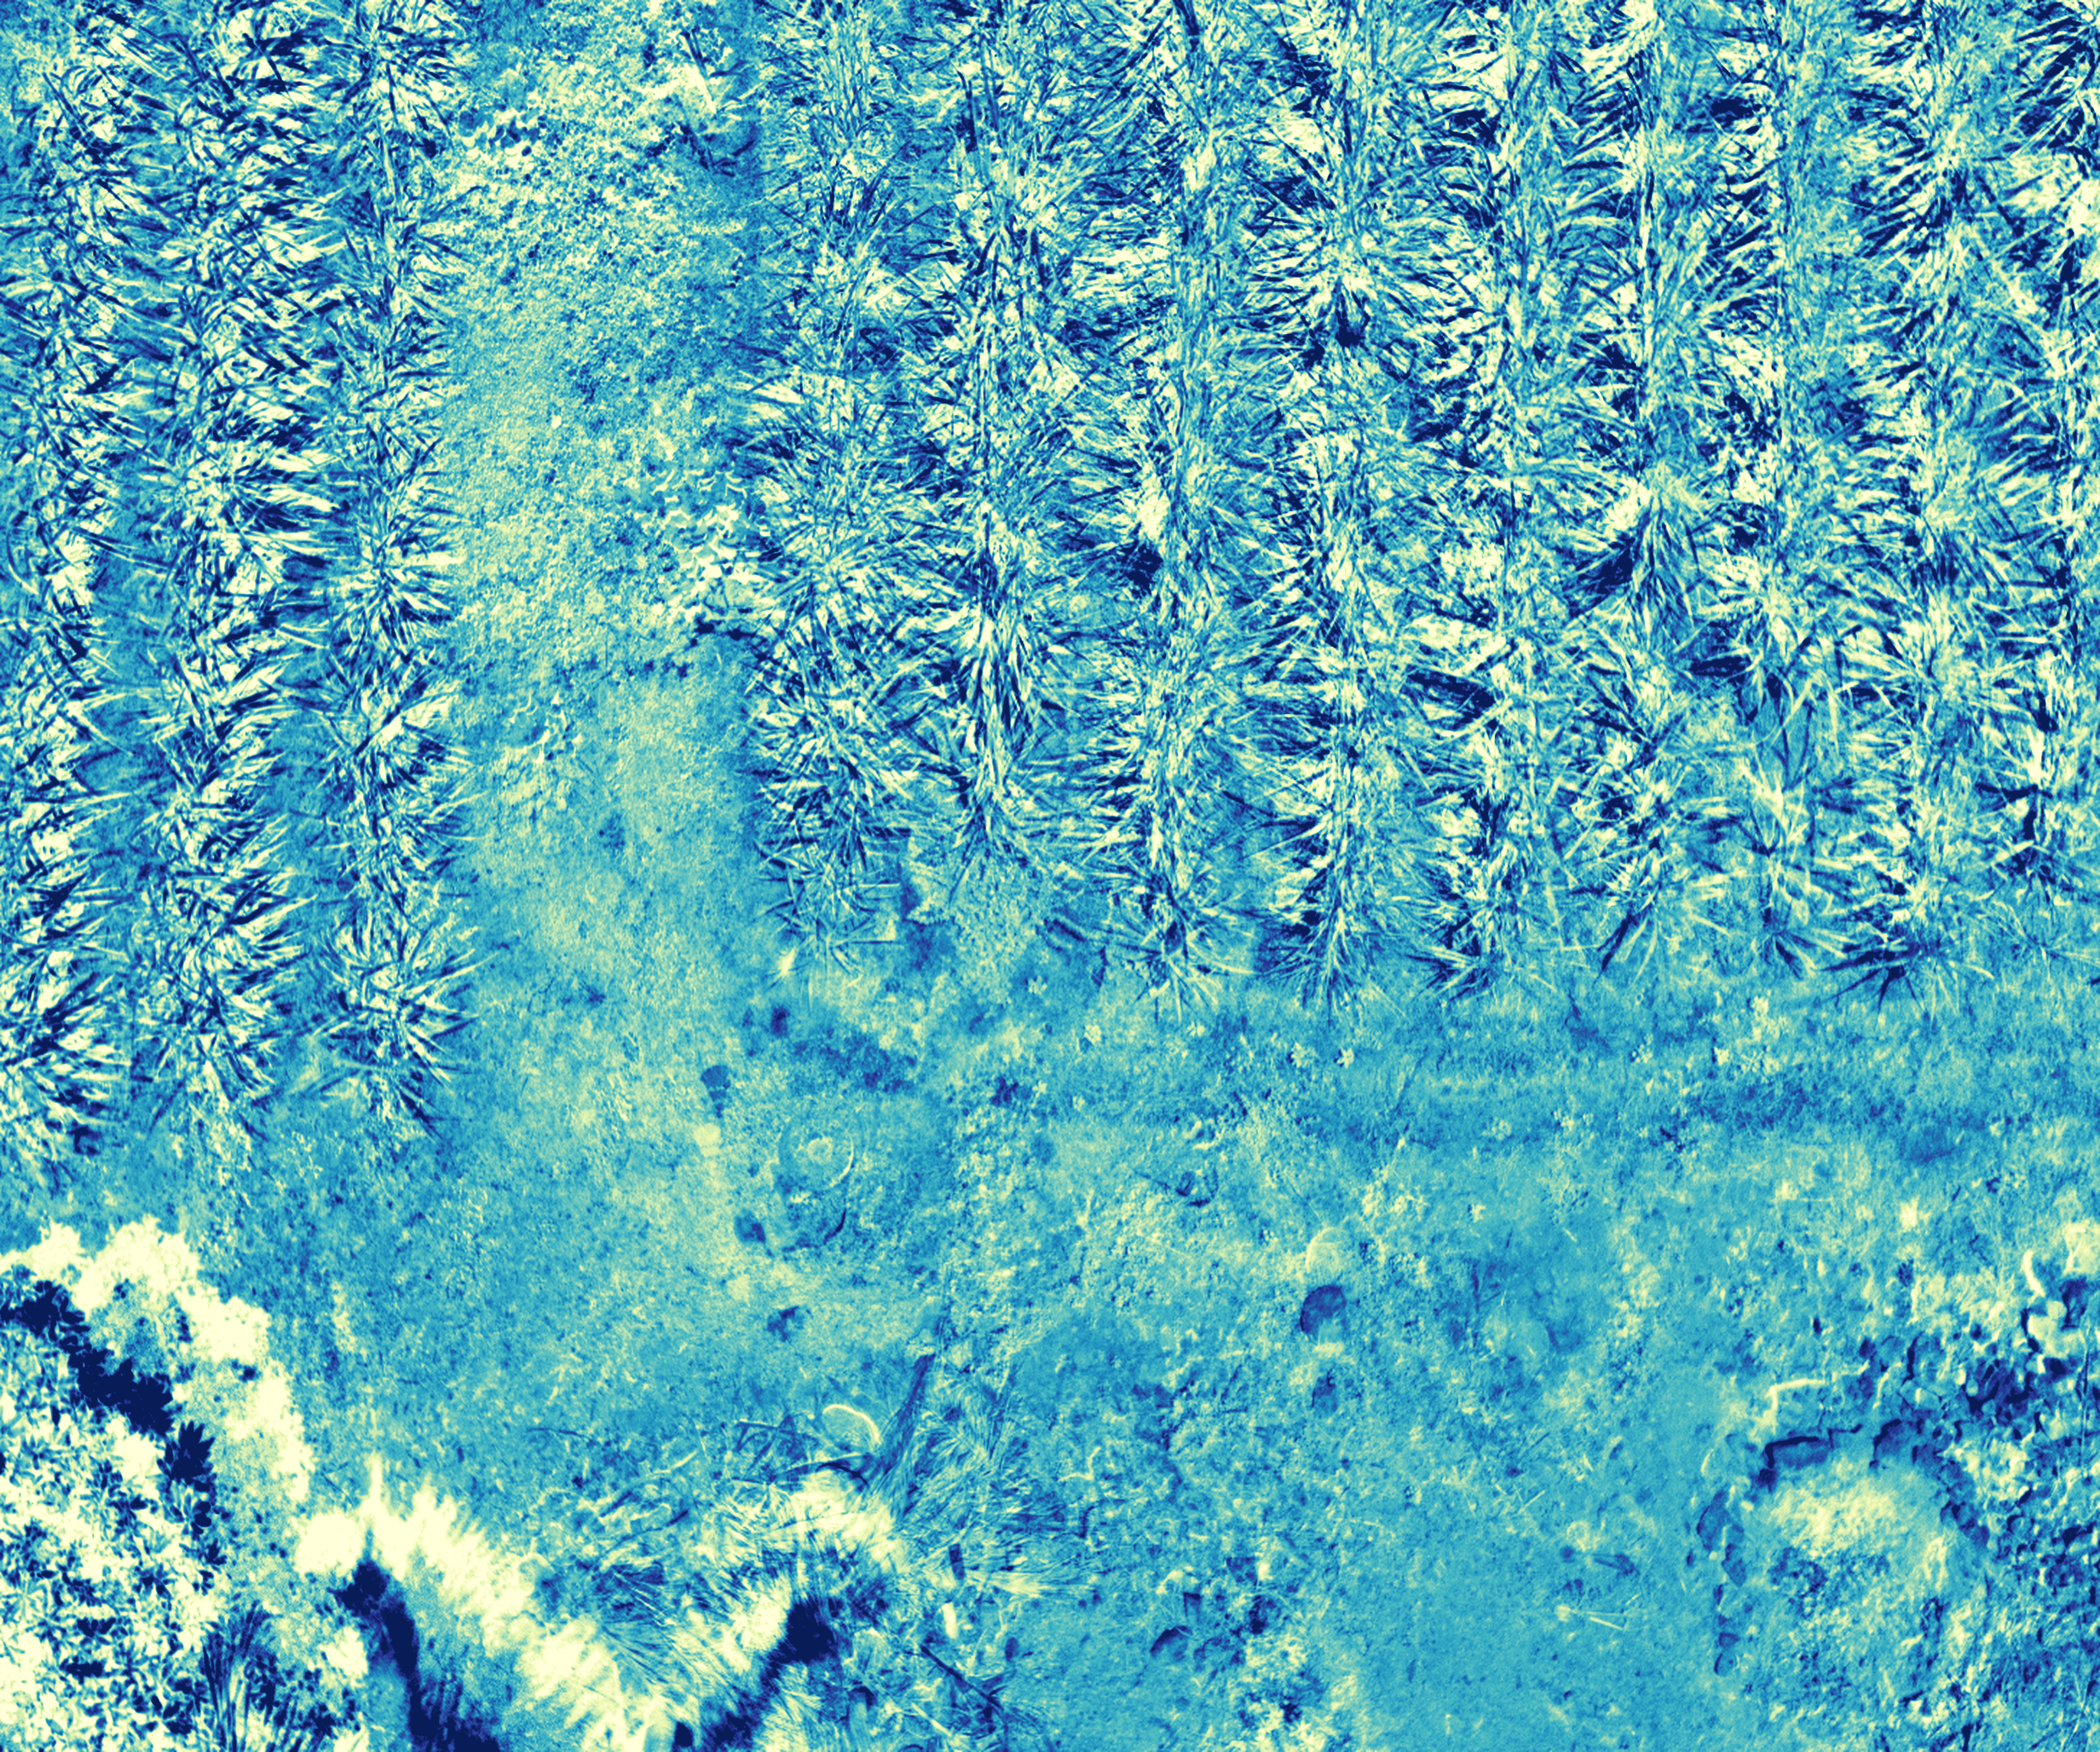
🌈 Index Visualizations (Sample Capture)
NDVI
NDRE
NDWI
📜 Expert Agronomic Analysis
Based on comprehensive multispectral data analysis of RGB, False Color, NDVI, and statistical trends.
💡 Precision Agronomic Strategy
The report shows the field as "Healthy" because statistically, your Sugar Cane is doing well for its current age. However, the purpose of this precision pipeline is to move beyond "blanket" assessments. The AI is recommending intervention in these 5 zones to maximize yield potential by ensuring the entire field matures at the same rate.
Executive Summary
High-resolution drone analytics reveal that 95.79% of the 42-guntha area (43,812 sq.ft) is currently experiencing water stress, while 81.05% (37,072 sq.ft) shows significant nutrient loss, contradicting low-resolution satellite reports that marked the field as 100% healthy. Although 95.8% of the field is classified as 'Healthy' relative to the local mean, the absolute vigor indices are sub-optimal for this growth stage. We prescribe highly-targeted precision applications of Urea and localized drip irrigation to rectify the widespread chlorophyll deficit and ensure uniform maturation across the 42,000+ sq.ft plot.
🌱 Vegetation Health Analysis
Overall Vigor: Overall vigor is moderate but below the genetic potential for Saccharum officinarum. The mean NDVI of 0.4898 indicates incomplete canopy closure, which is corroborated by the RGB imagery showing visible soil between rows. The MSAVI2 and OSAVI values (0.3238 and 0.3513 respectively) are low, suggesting that soil background reflectance is currently inflating the NDVI, masking the true extent of the vegetation lag.
Chlorophyll Content: Chlorophyll content is critically low for a high-biomass crop like sugarcane. The NDRE mean of -0.1369 and p95 of -0.0681 confirm that even the healthiest segments of the field are struggling with nitrogen uptake. This lack of leaf nitrogen will significantly impact the sucrose accumulation phase if not addressed immediately.
Uniformity: The field shows high relative uniformity (Std Dev of 0.037 for NDVI), which indicates that the stress is systemic across the entire 42 Gunthas rather than localized. This suggests a management-level shortfall in irrigation or fertilization scheduling rather than an isolated pest outbreak.
⚠️ Stress & Anomalies
| Identified Issue | Evidence | Severity |
|---|---|---|
| Systemic Nitrogen Deficiency | Mean NDRE is -0.1369 and CHL_Index is negative (-0.1427), indicating a severe lack of active chlorophyll production. | High |
| Widespread Canopy Dehydration | 95.79% of the field area (43,812 sq.ft) is flagged under water stress parameters in the GIS data. | High |
| Localized Weed Interference | GIS parameters identify 2,889 sq.ft (6.32%) of weed clusters, primarily in the bare soil gaps between rows. | Low |
🏗️ Infrastructure & Non-Crop Objects
| Object Type | Description & Location |
|---|---|
| Bare Soil Inter-rows | Large areas of exposed soil are visible between the cane rows, leading to high moisture evaporation and weed growth. |
| Vegetated Perimeter | Dense green vegetation visible in the bottom left of the RGB/NDVI images, likely serving as a source for weed seed dispersal. |
🚁 Targeted Spraying Prescription
| Treatment/Chemical | Dosage/Qty | Target Area | Agronomic Reasoning |
|---|---|---|---|
| Liquid Urea (46% Nitrogen) + Micronutrient Mix (Zn, Fe, Mn) | 5 Liters per hectare in 500L water mix | Entire 42 Guntha plot (37,072 sq.ft specifically showing nutrient loss) | To immediately address the chlorosis indicated by negative NDRE and CHL_Index values. |
| Propiconazole 25% EC (Fungicide) | 500 ml per hectare | 26,480 sq.ft identified as high-risk pest/disease zones | Preventative measure against Sugarcane Rust and other foliar pathogens prevalent in stressed crops. |
✅ Actionable Recommendations
- Implement an immediate precision nitrogen boost to raise NDRE levels above 0.20.
- Increase irrigation frequency or volume to cover the 43,812 sq.ft identified as stressed.
- Apply a preventative fungicide to mitigate the 57.89% pest/disease risk area detected.
- Conduct a low-altitude drone scout at 30m AGL for the 2,889 sq.ft of identified weed patches.
🌊 Canopy Hydration Analysis (NDWI)
Canopy Hydration: The NDWI mean of -0.1786 and the high percentage of water stress area (43,812 sq.ft) indicate a dry canopy. In multispectral heatmaps, the lack of blue/deep cyan tones suggests the crop is nearing its permanent wilting point, which is dangerous for sugarcane during the elongation phase.
Irrigation Uniformity: Irrigation appears consistently insufficient. The visual data shows consistent drying patterns between rows, implying that the current irrigation volume is not meeting the evapotranspiration demands of the crop.
Moisture Zone Distribution:
🐛 Pest & Disease Risk Assessment (NDRE/SIPI)
Risk Assessment: Pest and disease risk is classified as High, affecting 57.89% of the area (26,480 sq.ft). The combination of low nitrogen and water stress makes the crop highly susceptible to secondary infections and opportunistic pests.
Suspected Pathogens/Pests: Based on the spectral signatures of leaf yellowing and the low NDVI/NDRE, the crop is at risk for Sugarcane Rust (Puccinia melanocephala) and early infestation of Whitefly or Shoot Borer (Chilo infuscatellus), which thrive on weakened, drought-stressed cane.
Pest Risk Zone Distribution:
📋 Flight Settings & Checklist
⚙️ Flight Parameters
| Target Altitude (AGL) | 40 m |
| Target GSD (Resolution) | 1.2 cm/px |
| Overlap Settings | 80% Forward, 75% Side overlap for orthomosaic generation. |
| Optimal Flight Timing | Best captured between 10:00 AM and 2:00 PM to minimize shadows. |
💡 Weed Identification Flight Guide
To identify individual weeds, flight altitude must be lowered to 30-40 meters AGL to achieve sub-centimeter GSD. False Color and NIR bands should be analyzed to distinguish weed spectral signatures from sugar cane.
📋 Preflight Checklist
- Wipe clean all 5 spectral lenses and the panchromatic lens.
- Capture radiometric calibration panel images before and after flight.
- Ensure DLS2 (Downwelling Light Sensor) is completely unobstructed.
- Verify RTK GPS fix or wait for 3D GPS lock with at least 15 satellites.
🔍 Stitched Real Field & Multispectral Orthomosaics
High-resolution stitched RGB true-color orthomosaic alongside analytical NDVI, NDRE, and NDWI heatmaps. We have added Pansharpened RGB (Brovey Transform) and Panchromatic Grayscale layers to produce ultra-sharp imagery. Use the interactive GIS map below to toggle layers and view the exact, color-coded precision intervention zones (Urea Spray, Drip Irrigation, Weed Spot-Treatments, Pest Spray) designed for direct action.
💡 Scroll to zoom, drag to pan, and toggle layers using the menu on the top right.
Low NDRE. Requires Nitrogen boost.
High NDWI. Requires irrigation increase.
High NDVI. Requires spot-herbicide spray.
Low NDRE / High SIPI. Requires pest control.
📷 Camera & Flight Information
| Camera Model | RedEdge-P |
| Serial Number | PR01-2145023-MS |
| Firmware | v1.3.2 |
| Flight Date | 2026:06:01 06:41:30 |
| Altitude (avg) | 603.5 m |
| Spectral Bands | Blue (475nm), Green (560nm), Red (668nm), RedEdge (717nm), NIR (842nm), Panchromatic |
| Sensor Resolution | 1456×1088 (MS) / 2464×2056 (Pan) |
| GPS Bounds | 17.067696°N to 17.068548°N, 74.275227°E to 74.275530°E |
| Total Images | 570 (95 captures × 6 bands) |